Microsoft Power Tools for Data Analysis: Dashboards & Reports. Class Introduction Video. MSPTDA #01.
Download Excel File: https://people.highline.edu/mgirvin/AllClasses/348/MSPTDA/Content/Intro/001-MSPTDA-IntroToClass.xlsx
Download pdf Notes: https://people.highline.edu/mgirvin/AllClasses/348/MSPTDA/Content/Intro/001-MSPTDA-IntroToClass.pdf
This video introduces the topics that will be covered in this Highline College BI 348 Class:
Name of Class:
BI 348 – Microsoft Power Tools for Data Analysis:
• Power Query
• Power Pivot
• DAX
• Power BI Desktop
• Excel
For Creating:
• Data Models, Reports, Dashboards and Analytics
Taught by Mike excelisfun Girvin, Excel MVP 2013-2018
• A class about connecting to multiple source of data, transforming the data into a refreshable & dynamic data model, and building reports and dashboards to provide insightful and actionable information.
Prerequisites for this class:
• Busn 216: Excel Basics, https://www.youtube.com/playlist?list=PLrRPvpgDmw0n34OMHeS94epMaX_Y8Tu1k
• Busn 218: Advanced Excel, https://www.youtube.com/playlist?list=PLrRPvpgDmw0lcTfXZV1AYEkeslJJcWNKw
• Busn 210: Business Statistics, https://www.youtube.com/playlist?list=PLrRPvpgDmw0ngx_uPhvasTbOWLOztsaBj
What Version of Excel:
• Office 365 (updated each month)
What Version of Power BI Desktop:
• Free Tool we will download (update each month)
Over View of Topics for the class:
1. Data Analysis / Business Intelligence terms and concepts that we will learn in this class:
• Proper Data Set
• Fact Table
• Dimension Tables
• Relationships
• Star Schema
• ETL
• Measures
• Dashboards
• SQL
• Data Warehousing
2. Learn how to use Excel Power Query:
• Import Data from multiple sources
• Clean and Transform Data
• Create Data Components for Star Schema Data Models
• Load Data To Excel, the Data Model and Connection Only
• Replace Complicated Excel Solutions with Power Query Solution
• Use the Power query User Interface to create Power Query Solutions
• Learn about the Case Sensitive, Function-based M Code Language that is behind the scenes in Power Query
3. Learn how to use Excel Power Pivot:
• Excel Power Pivot provides:
i. Data Model where we can have multiple tables, formulas and relationships (Star Schema)
ii. Columnar Database to hold "Big Data" and process quickly over that "Big Data"
iii. New Formula Language called DAX:
1. Many More Calculations than in Standard PivotTable
2. Build One Formula that can work in many reports
3. Add Number Formatting to Formulas
• Excel Power Pivot to:
i. Replace VLOOKUP Formulas and Single Flat PivotTable Data Source with Multiple Tables, Relationships in the Data Model to create more efficient Reports & Dashboards
ii. Use Power Pivot Columnar Database to hold millions of rows of data
iii. DAX formulas have more Power than Standard PivotTable Calculations
4. Learn about Building Star Schema Data Models:
a. Why they are important in Power Pivot and Power BI Desktop
b. How to build them using:
i. Power Query
ii. Power Pivot
iii. DAX
iv. Power BI Desktop
5. Learn how to author DAX Formulas for Excel’s Power Pivot & Power BI Desktop:
a. Calculated Column Formulas for Data Model
b. Measure Formulas for PivotTables
c. DAX Functions like SUMX, CALCULATE, RELATED, and Much More…
d. Lean why we must create Explicit rather than Implicit formulas
e. Learn how Row Context works in formulas
f. Learn how Filter Context works in formulas
g. Learn about Scalar & Table Functions
h. Use DAX Studio to visualize and analyze DAX Formulas
6. Learn how to use Power BI Desktop:
a. Power Query to import, clean, transform and create Star Schema Data Models
b. Create Relationships
c. Create DAX Formulas
d. Build Interactive Visualizations
e. Build Dashboards
7. Learn how to use Excel:
• Spreadsheet Formulas & Functions
• Standard PivotTables
• Power Query
• Power Pivot
• Build Data Model PivotTables and the resultant Reports, Dashboards and Analytics
8. Building Refreshable, Insightful Dashboards
a. Build Excel Dashboards
b. Build Power BI Dashboards
9. Case Studies to practice using Power Pivot & Power BI Desktop for Reporting, Building Dashboards and Building Business Analytics Solutions
The Power Query logo used in this video is copyright of and used with the express permission of https://powerquery.training
Thanks to Ken Puls and Miguel Escobar for letting me use their logo!!!!
Видео Microsoft Power Tools for Data Analysis: Dashboards & Reports. Class Introduction Video. MSPTDA #01. канала excelisfun
Показать
Комментарии отсутствуют
Информация о видео
Другие видео канала
 YTL Excel #130: Income Statement from Excel Table: Array For
 Ctrl + Shift + Enter: Excel Array Formulas #05: Function Argument Array Operations
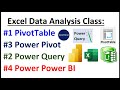 Free Data Analysis Class: Intro to PivotTable, Power Query, Power Pivot, Power BI & Big Data
 Introduction to the excelisfun Channel @ YouTube: Excel & Power BI Videos & Free Classes_
 Store Full Table to One Column? Excel Power Query Puts Records in One Cell! Excel Magic Trick1734.
 Power Query Running Count with Grouping & Add Index - Excel Magic Trick 1589
 Power Query to Import Excel File From OneDrive SharePoint into PivotTable, Refresh New Data EMT 1756
 Excel 2013 Statistical Analysis #5 Data Categorical, Quantitative, Nominal, Ordinal, Interval, Ratio
 MSPTDA #02: Data Analysis Business Intelligence Terms: Microsoft Power Tools for Data Analysis Class
 excelisfun’s new book The Only App That Matters Book is Released!!! Microsoft 365 Excel = The Best!
 MSPTDA 12: Using Locale in Power Query Power BI: Import & Append Text Files from Different Countries
 Spilled Array Formulas Make Excel Life Easy. Compare Two Lists Extract Items Excel Magic Trick 1750
 MSPTDA 14: Power Pivot Intro #2: Amazing Columnar Database Importing Millions of Rows Data to Excel
 MSPTDA 21: Power Query: Reduce Data Model Size, Transformations to Columnar Database Size
 Office 2013 Class #37: Excel Basics 19: SUMIFS, COUNTIFS: Add & Count with Criteria/Conditions
 Highline Excel 2013 Class Video 05: Cell References: Relative, Absolute & Mixed (8 Examples)
 INDEX & MATCH or XLOOKUP for Lookup Formula in SUMIFS Criteria Argument. Excel Magic Trick 1668.
 E-DAB 09: Power BI Desktop: Data Modeling & Interactive Visualizations
 Excel Two Way Lookup with VLOOKUP & MATCH Functions - Excel Magic Trick 1567
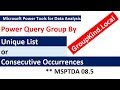 MSPTDA 08.5: Power Query Group By Unique List or Consecutive Occurrences
 E-DAB 01: What is Data Analysis & Business Intelligence?