E-DAB 08: Power Pivot: Big Data, Data Modeling, DAX & Dashboards
Download all files to follow along with video and do homework is zipped folder here: https://people.highline.edu/mgirvin/AllClasses/348/MSPTDA/Content/EDAB/DownloadFilesForEDAB08.zip
To download individual files, visit class web site here: https://people.highline.edu/mgirvin/AllClasses/348/MSPTDA/Content/EDAB/EDAB.htm
This video is an introduction to Data Modeling in Excel Power Pivot to create reports and Dashboards. Learn how to use Power Query to import SQL Big Data into the Data Model. Learn how to build DAX Formulas. Lean how to create an entire Data Model and then build Data Model PivotTables and Data Model Charts.
This class : Data Analysis & Business Intelligence Made Easy with Excel Power Tools - Excel Data Analysis Basics = E-DAB Class – Sponsored by YouTube and taught by Mike Girvin, Highline College Instructor, Microsoft Excel MVP and founder of the excelisfun channel at YouTube. This is a free educational resource for people how want to learn about the Basics of Data Analysis and Business Intelligence using Microsoft Power Tools such as, PivotTables, Power Query, Power Pivot, Power BI Desktop and more.
Topics:
1. (00:15) Introduction & Over view of entire Big Data & DAX Project.
2. (02:20) Download Files.
3. (02:57) What is a Data Model PivotTable and why Power Pivot is called “Power Pivot”
4. (04:03) Differences Between Standard PivotTable & Data Model PivotTable
5. (06:20) Average Daily Reve Example and why DAX is Easier than Standard PivotTable.
6. (07:33) Choice between: Standard PivotTable & Data Model PivotTable
7. (08:18) What is a SQL Database?
8. (09:06) Import Big Data from SQL Database using Power Query
9. (11:10) Load SQL Tables into Columnar Database in Power Pivot’s Data Model
10. (11:38) How to get into the Data Model. Into to Data Model.
11. (13:00) Create Relationships in Design View
12. (14:17) What is a Date Table? Create Date Table.
13. (18:40) Hide Column From Client Tool
14. (19:30) Overview of DAX Formulas
15. (20:58) DAX Calculated Column for Line Revenue
16. (23:42) Row Context
17. (25:55) DAX Measure to add Calculated Column using SUM
18. (27:07) SUMX DAX Measure to calculate Total Revenue without a Calculated Column.
19. (29:37) Compare and contrast Calculated Column and Measures.
20. (31:18) Create Data Model PivotTable
21. (33:22) Filter Context
22. (35:03) Create More DAX Formulas: Total COGS, Gross Profit and Percent Gross Profit.
23. (37:54) Create Dashboard for Gross Profit.
24. (40:20) Create Running Total and Average Daily Revenue DAX Measures and Final Data Model PivotTable.
25. (43:40) Summary
Видео E-DAB 08: Power Pivot: Big Data, Data Modeling, DAX & Dashboards канала ExcelIsFun
Показать
Комментарии отсутствуют
Информация о видео
Другие видео канала
 E-DAB 09: Power BI Desktop: Data Modeling & Interactive Visualizations
 E-DAB 07: Data Modeling: VLOOKUP, Power Query or Power Pivot?
 Smart Excel Pivot Table Trick - Choose Your KPI from Slicer (Excel Dashboard with DAX)
 E-DAB 01: What is Data Analysis & Business Intelligence?
 How to use a Pivot Table to Analyze 3 years of SALES DATA in Excel
 MSPTDA 26: Budget vs Actual in Power Pivot & Power BI Desktop, DAX & Data Model
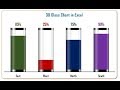 Info-graphics: 3D Glass Chart in Excel
 Excel Data Analysis Class 02: Power Pivot, DAX Formulas, Relationships, Data Modeling & Much More!
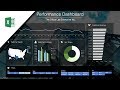 How to build a Well-Designed and Interactive Excel Dashboard with Pivot Tables and Pivot Charts
 MSPTDA 04: Power Query: Import Multiple Excel Files & Combine (Append) into Proper Data Set
 Microsoft Power Tools for Data Analysis: Dashboards & Reports. Class Introduction Video. MSPTDA #01.
 Create a Pivot Table from Multiple Sheets in Excel | Comprehensive Tutorial!
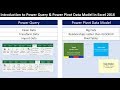 Introduction to Power Query & Power Pivot Data Model in Excel 2016 (Excel Magic Trick 1468)
 Data Modeling: Create Relationship in Power Pivot
 ☑️ Top 25 Advanced Pivot Table Tips & Tricks For Microsoft Excel
 The Ultimate Budget Allocation Methodology For Power BI Analysis
 Combine Data from Multiple Excel Files in a Single Excel Sheet - Part 1
 Power BI Advanced Tutorial
 Combine Files With Inconsistent Columns In Power Query