Beautiful Progressive Doughnut Chart with Dynamic Target Line in Excel (Step by Step Tutorial)
Beautiful and Dynamic Progressive Doughnut Chart in Excel with Target Line
In this video, we will learn how to create progressive doughnut chart in Excel with Target line. It's very easy and step by step tutorial on Doughnut chart
#Doughnut-Chart #TheDataLabs
Please follow the below link to download the Excel file used in this tutorial.
https://thedatalabs.org/
Please visit our website www.thedatalabs.org
Please contact us on info@thedatalabs.org
Thanks for watching!
Please like, share, comment and subscribe.
Have a great day!
Видео Beautiful Progressive Doughnut Chart with Dynamic Target Line in Excel (Step by Step Tutorial) канала TheDataLabs
Показать
Комментарии отсутствуют
Информация о видео
Другие видео канала
 Excel Actual v Target Charts
![Doughnut Chart for Excel Dashboards: Simple and Easy way! [Excel Free Template]](https://i.ytimg.com/vi/PcnLu4yzH_Q/default.jpg) Doughnut Chart for Excel Dashboards: Simple and Easy way! [Excel Free Template]
Doughnut Chart for Excel Dashboards: Simple and Easy way! [Excel Free Template] Progress Circle Chart in Excel as NEVER seen before!
 Info-graphics: Ring Chart in Excel
 Tableau Tutorial - KPI Donut Chart
 Using the New IFS Function in Excel
 MS PowerPoint Tutorial: Multi-Level Wheel/Doughnut Diagram (Training Provider Malaysia)
 How to use AVERAGE, AVERAGEA and AVERAGEX in Power BI // Beginners Guide to Power BI in 2020
 Excel Doughnut Chart - Conditional Formatting | FREE Download
 Info-graphics: Group of Circle Charts in Excel
 Excel Pivot Tables EXPLAINED in 10 Minutes (Productivity tips included!)
 3D Disk Pie Chart in Excel || Learn in less than 5 Minutes
 10 Advanced Excel Charts
 Refresh All Pivot Tables Automatically When Source Data Change - Excel VBA
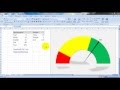 Create Speedometer Chart In Excel
 Excel Actual Vs Target Chart - Conditional Formatting & Dynamic Target | FREE Download
 This Excel Chart will grab your attention (Infographic template included)
 Target Bar Chart in Tableau | Analytics Planets
 Excel Lookup to Return Multiple Values with FILTER Function