Sci-Vis on the Web using VTK.js
Presented by Bill Sherman.
2018-2019 Scientific Visualization Workshop at Indiana University. Filmed Nov 28, 2018.
This workshop series highlights a variety of topics related to scientific visualization. Principles of perception, along with techniques and tools for creating visualizations from scientific datasets is discussed.
Participants learn about modern tools for analyzing simulated and observed scientific data. Different types of data is explored ranging from 3D volumetric scan data, to vector fields, molecular simulations, and point clouds. Methods for visualizing both static and time-varying data is explored as well.
Different interface technologies as they are applied to visualization such as virtual and augmented reality, and 3D digitization and printing is also discussed.
Go to the playlist for the series: https://www.youtube.com/playlist?list=PLqi-7yMgvZy9nAQMPm_TSyOaPX8Eb5RZl
The series was hosted by Bill Sherman and the Advanced Visualization Lab, Research Technologies (RT). RT is a division of University Information Technology Services and a center in the Pervasive Technology Institute at Indiana University.
The Supercomputing for Everyone Series (S4ES) of training workshops aims to bring more users into the realm of advanced computing, whether it be visualization, computation, analytics, storage, or any related discipline.
For more information visit: https://ittraining.iu.edu/explore-topics/titles/sci-vis/index.html
UITS Research Technologies: https://rt.iu.edu
Pervasive Technology Institute: https://pti.iu.edu
Видео Sci-Vis on the Web using VTK.js канала IUPTI
Показать
Комментарии отсутствуют
Информация о видео
Другие видео канала
 1.3: Data Types : Intro to R for Biologists
 Virtual Tourism
 Applied Bioinformatics: Interdisciplinary curriculum built on open source technology, 20160629
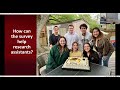 Research Assistant Management Using REDCap - Sydney Aller
 What's New in REDCap 11.1?
 Creating Reports in IU REDCap
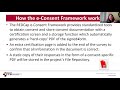 Using the e-Consent Framework in IU REDCap 01/14/2021
 Biostatistics and Health Science and IU REDCap - Steven Brown and Netsanet Gebregziabher
 Introduction to Galaxy interactive elements, 20160626
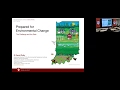 IU PTI Seminar: Prepared for Environmental Change: the Challenge and the Data Source
 5.1-2: Scripts : Intro to R for Biologists
 A Survey of VR Experiences
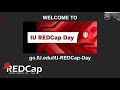 IU REDCap Day Intro - Joe Butler
 From a Research Perspective: Setting Up Surveys - Brenda Hudson
 IU's supercomputer, "Big Red": Craig Stewart on WTHR13
 IU REDCap: @CALCTEXT and @CALCDATE
 IU REDCap: Data Quality Module
 What's New in REDCap 12.0?
 Introduction to High Performance Computing (HPC) at Indiana University (IU) 2/18/2021
 Differential Expression Introduction
 Consenting, Experiments, and Workflows; How REDCap Improved Our Research - Christopher Hobbick