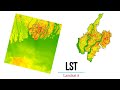
Calculating Land Surface Temperature Landsat8 by ArcGIS
Standard Landsat 8 data products provided by the USGS EROS Center consist of quantized and calibrated scaled Digital Numbers (DN) representing multispectral image data acquired by both the Operational Land Imager (OLI) and Thermal Infrared Sensor (TIRS). The products are delivered in 16-bit unsigned integer format and can be rescaled to the Top Of Atmosphere (TOA) reflectance and/or radiance using radiometric rescaling coefficients provided in the product metadata file (MTL file), as briefly described below. The MTL file also contains the thermal constants needed to convert TIRS data to the top of atmosphere brightness temperature.
While the TIRS bands were designed to allow the use of split-window surface temperature retrieval algorithms, (such as the use of split window techniques for atmospheric correction and retrieval of surface temperature values), it is recommended that users refrain from relying on band 11 data in quantitative analysis of the TIRS data due to the larger calibration uncertainty associated with this band.
Since the launch of Landsat 8 in 2013, thermal energy from outside the normal field of view (stray light) has affected the data collected in TIRS Bands 10 and 11. This varies throughout each scene and depends upon radiance outside the instrument field of view, which users cannot correct in the Landsat Level-1 data product. Band 11 is significantly more contaminated by stray light than Band 10. It is recommended that users refrain from using Band 11 data in quantitative analysis including use of Band 11 in split-wind surface temperature retrieval algorithms. Details about Landsat 8 TIRS stray light can be found in Appendix A of the
Conversion to TOA Radiance
OLI and TIRS band data can be converted to TOA spectral radiance using the radiance rescaling factors provided in the metadata file
Conversion to Top of Atmosphere Brightness Temperature
TIRS band data can be converted from spectral radiance to top of atmosphere brightness temperature using the thermal constants provided in the metadata file
3) Conversion from At-Satellite Temperature to Land Surface Temperature
Now we are ready to convert the At-Satellite Brightness Temperature to Land Surface Temperature, using the following equation.
Видео Calculating Land Surface Temperature Landsat8 by ArcGIS канала Made 4 Geek
Показать
Комментарии отсутствуют
Информация о видео
Другие видео канала
 Estimating Land Surface Temperature Landsat 8 | ArcGIS Tutorial | 2020
 Principles of Surface Temperature Measurement
 Downloading Landsat 8 images from USGS EarthExplorer
 How to extract Elevations from DEM to points of sampling grid in ArcGis
 Landsat 8: Estimating Land Surface Temperature Using ArcGIS
 Flood Monitoring Tutorial with Sentinel 2 and Landsat 8 Images in QGIS 3
 Urban Heat Island | Causes, Consequences and Mitigation | Climatology | Dr. Krishnanand
 Normalized Difference Vegetation Index NDVI Geogrphic informations system ARCGIS - ESRI - GIS
 How to Calculate Land Surface Temperature using Landsat8 in ArcMap 10.5
 How To Add a Locator Map in ArcGis
 استخلاص درجة حرارة سطح الارض من المرئيات الفضائية LST from Landsat 8
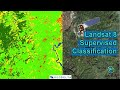 Landsat 8 Image Classification with ArcGIS (Supervised)
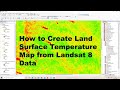 How to calculate land surface temperature from Landsat 8 Satellite Data
 Landsat NDVI time-series in Google Earth Engine
 ArcGIS Tutorial - Create DEM and Contours using Google Earth
 NDVI calculation from Landsat8 images with Python 3 and Rasterio - Tutorial
 Geostatistical Analysis: Spatial Interpolation || Rainfall Estimation using IDW Technique in ArcGIS
 Calculating Land Surface Temperature (LST) of Landsat 7 and Landsat 5 | ArcGIS Tutorial
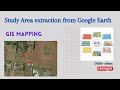 Study Area extraction from Google Earth and Export in ArcMap
 Land surface Temperature from Landsat 8 using ArcMap GIS