M 365 Excel Worksheet Formulas & Models – Everything You Ever Wanted To Know - 365 MECS 03
Download Excel File: https://excelisfun.net/files/03-M365ExcelClass.xlsx Download PDF File: https://excelisfun.net/files/03-M365ExcelClass.pdf
This video is a comprehensive lesson in using Excel Worksheet functions and formulas to build Worksheet Solutions and Models.
This full free Microsoft 365 Excel & Power BI class is taught by Excel MVP and Highline College Professor and can be found here: https://www.youtube.com/playlist?list=PLrRPvpgDmw0nre_bTeBfJWjrnixKoyNtW
Topics in video:
1. (00:00) Introduction
2. (01:12) List of Formula Elements
3. (01:54) Discuss Different Formula Types
4. (05:16) Examples of Modes of Formula Editing
5. (07:35) Examples of the five Calculation Formula Types
6. (08:43) Type #1: Relative and Absolute Cell References in Single Input-Output Formula
7. (12:40) When you must use ROUND function
8. (15:34) Use General Number Format as eraser to remove Number Formatting
9. (16:56) Type #2: Dynamic Spilled Array Formulas
10. (19:35) Spilled Range Operator for Dynamic Spilled Array Formulas
11. (20:07) Type #3: Excel Table Formulas
12. (25:47) Summary about SIOF, DSAF and TF formulas.
13. (26:34) Type #5: Aggregate Formulas
14. (26:43) Type #4: Scalar Array Formulas
15. (28:40) Style Formatting for Models
16. (33:13) Compare Number Formats: Accounting, Currency and Number
17. (38:00) Build Model #1: Sales & Expenses Budget
18. (49:40) Build Model #2: Markup On Cost Pricing Formulas
19. (54:32) Build Model #3: Date & Time Formulas & Number Formatting to calculate total days and total time for a work project
20. (01:02:24) Build Model #4: Largest Profit for Each Product. Learn about functions: UNIQUE, SORT and MAXIFS
21. (01:09:12) Look at Finance Cashflow Model to help pick investment
22. (01:09:42) Look at Analytics Simulation Model to product risk of new project
23. (01:10:05) Homework or practice problems
24. (01:10:21) Conclusion
25. (01:10:50) Closing and Video Links
Song in video: Rock Intro 3 by Audionautix is licensed under a Creative Commons Attribution 4.0 license. https://creativecommons.org/licenses/by/4.0/ . Artist: http://audionautix.com/
#MikeGirvin
#excelisfun
#MikeexcelisfunGirvin
#Microsoft365Excel
#freeclass
#freecourse
#formulas
#functions
#DynamicSpilledArrayFormulas
#Microsoft365Formulas
#M365ExcelVideo3
#MECS3
#ComprehensiveFormulaLesson
#CompleteFormulaLesson
#ExcelFormulaClass
#LearnExcelFormulas
#SORTfunction
#UNIQUEfunction
#sumifs
#MAXIFS
#Excel’sGoldenRule
#excelisfunformulasfunctions
#BuildingModelsinExcel
#Excelsolutions
#freeclass
#excelformulas
#excelfunctions
#excelfunction
#excelmvp
#modleing
#modler
#formulas
#functions
#solution
#solutions
Видео M 365 Excel Worksheet Formulas & Models – Everything You Ever Wanted To Know - 365 MECS 03 канала ExcelIsFun
Показать
Комментарии отсутствуют
Информация о видео
Другие видео канала
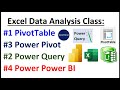 Free Data Analysis Class: Intro to PivotTable, Power Query, Power Pivot, Power BI & Big Data
 Introduction to the excelisfun Channel @ YouTube: Excel & Power BI Videos & Free Classes_
 Store Full Table to One Column? Excel Power Query Puts Records in One Cell! Excel Magic Trick1734.
 Power Query Running Count with Grouping & Add Index - Excel Magic Trick 1589
 Excel 2013 Statistical Analysis #5 Data Categorical, Quantitative, Nominal, Ordinal, Interval, Ratio
 Spilled Array Formulas Make Excel Life Easy. Compare Two Lists Extract Items Excel Magic Trick 1750
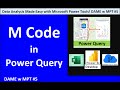 DAME 05: Master Power Query M Code & Become a Data Shaping Ninja (The Secret Behind Data Analysis)
 MSPTDA 12: Using Locale in Power Query Power BI: Import & Append Text Files from Different Countries
 MSPTDA 08.5: Power Query Group By Unique List or Consecutive Occurrences
 MSPTDA 14: Power Pivot Intro #2: Amazing Columnar Database Importing Millions of Rows Data to Excel
 MSPTDA 21: Power Query: Reduce Data Model Size, Transformations to Columnar Database Size
 Office 2013 Class #37: Excel Basics 19: SUMIFS, COUNTIFS: Add & Count with Criteria/Conditions
 Highline Excel 2013 Class Video 05: Cell References: Relative, Absolute & Mixed (8 Examples)
 INDEX & MATCH or XLOOKUP for Lookup Formula in SUMIFS Criteria Argument. Excel Magic Trick 1668.
 E-DAB 01: What is Data Analysis & Business Intelligence?
 E-DAB 09: Power BI Desktop: Data Modeling & Interactive Visualizations
 Highline Excel 2013 Class Video 18: VLOOKUP Function 20 Examples, VLOOKUP Formula, Excel VLOOKUP
 Microsoft Power Tools for Data Analysis: Dashboards & Reports. Class Introduction Video. MSPTDA #01.
 Basic Excel Business Analytics #66: Monte Carlo Simulation for New Product, 3 Uncertain Variables
 E-DAB 07: Data Modeling: VLOOKUP, Power Query or Power Pivot?
 E-DAB 08: Power Pivot: Big Data, Data Modeling, DAX & Dashboards