Vertical and Circular Bullet Chart in Excel
#CircularBulletChart #ExcelCharts
Hello Friends,
In this video, You will learn how to a Vertical and Circular Bullet Chart in Excel. with 3 levels of color. We have displayed the Target point also in this chart. You can use this chart to display the KPI metric like Service Level, Quality Score or Gross Margin etc.
Download the practice files from below given link:
https://www.pk-anexcelexpert.com/vertical-and-circular-bullet-chart-in-excel/
Download the Free Project Management Dashboard
https://www.pk-anexcelexpert.com/excel-dashboard/project-management-dashboard
Download our free Excel utility Tool and improve your productivity:
https://www.pk-anexcelexpert.com/products/pks-utility-tool-v2-0/
See our Excel Products:
https://www.pk-anexcelexpert.com/products/
Visit to learn more:
Chart and Visualizations: https://www.pk-anexcelexpert.com/category/blogs/charts-and-visualization/
VBA Course: https://www.pk-anexcelexpert.com/vba/
Download useful Templates: https://www.pk-anexcelexpert.com/category/templates/
Dashboards: https://www.pk-anexcelexpert.com/excel-dashboard/
Watch the best info-graphics and dynamic charts from below link:
https://www.youtube.com/playlist?list=PLbDvAYjpWJ7CEAHn-iuGSeLbUtFnYekHr
Learn and free download best excel Dashboard template:
https://www.youtube.com/playlist?list=PLbDvAYjpWJ7CpupRYMRkXSN0L92t7nUuF
Learn Step by Step VBA:
https://www.youtube.com/playlist?list=PLbDvAYjpWJ7BcoaFQD-syOrZzNSLZycwH
Website:
https://WWW.PK-AnExcelExpert.com
Facebook:
https://www.facebook.com/PKAnExcelExpert
Telegram:
https://t.me/joinchat/AAAAAE2OnviiEk5o1o8i4w
Pinterest:
https://www.pinterest.com/PKAnExcelExpert/
Visit our Amazon Store
https://www.amazon.in/shop/pkanexcelexpert
Видео Vertical and Circular Bullet Chart in Excel канала PK: An Excel Expert
Показать
Комментарии отсутствуют
Информация о видео
Другие видео канала
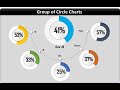 Info-graphics: Group of Circle Charts in Excel
 4 Hidden Excel Dashboard Design Tips for Beautiful Reports
 Don't Use Excel Filters! Use This Incredible Excel Formula Instead ...
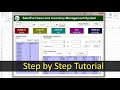 Inventory Management form in Excel | Step by step complete tutorial
 What-If Analysis (Goal Seek, Scenario Manager and Data Table) in Excel | Step by Step tutorial
 Vertical Bullet Chart in Excel
 Energy Consumptions Dashboard in Power BI | Step by Step complete tutorial
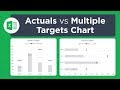 Actual vs Targets Chart in Excel
 How to create a bullet chart in Excel.
 Design, Publish and Share a Sales Dashboard in Power BI (Part-2)
 Dynamic Conditional Formatting in Power BI
 Dual Indicator Speedometer Chart in Excel
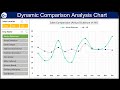 Dynamic Comparison Analysis Chart in Excel
 Quick Dashboard in Excel (Part-1)
 Stylish and Dynamic Comparison Chart | No Excel Shape or Picture used
 PowerPoint Animated Infographics Slide Design Tutorial
 Top Bottom Analysis Dashboard in Excel
 Gauge Chart hack for Excel Dashboards - Step by Step Gauge Chart Creation tutorial
 How to use Microsoft Power Query