Building Financial Dashboard in Google Data Studio | Complete profit & loss report Visualization
Building a Financial Dashboard in Google Data Studio from beginning/Scratch.
This is a complete Video of “Building financial Dashboard in Google Data Studio from Scratch" only with profit & loss account presentation in Google data studio.
In this course you will get the complete information in piratical way that how we can make financial dashboard in Google data studio.
This course will help us to prepare the following:
Dynamic, Meaningful & Professional weekly, Monthly and Annual web responsive financial reports. You can access the reports anytime, anywhere by sign in to your google account.
What will be covered in this Course?
Financial database visualization from financial reports:
Profit & Loss,
Balance Sheet
Cash Flow Statement
Connecting financial data through Google Sheets
Inserting Time series charts for Revenue, Expenses, Net profit and net profit Margins
Selection of Time series & Report time & Date selection Sharing reports & how we can update financial data Error recognition and fixing in Google data studio.
Scorecards to show the comparison of previous data Pie charts, Bar Charts & Area charts Creation of Page navigation to move around the report pages.
Study the following link better that how I have prepared the database in google sheets in accurate form for financial data visualization in google data studio. If the base data correctly sorted then the data visualization will be easy and we can manipulate the data in any form in google data studio to make the financial reports.
This Video has the following:
We have created a monthly revenue time series chart in google data studio to visualize the impact of our financial report in google data studio.
You will observe that how we have inserted the time series chart in google data studio also you will see that how we have control that time series chart as per our requirements in financial dashboard design in google data studio.
You will observe the date formatting if the time series chart shows the value of chart in daily basis.
We have done this by editing the data source as I have mentioned in this video. The selection of correct format and data in preparation of google data studio financial dashboard will help the google data studio to show us accurate results.
The idea is that we have 2 time fields, the 1st field is in Date format so data studio can understand the Time series and the 2nd date field is in month format to make the time series chart well designed and understandable for google data studio and as well for us.
We have discussed that how we can convert our line charts to bars char and how we can move our time series line breaks chart to leave zero coroner.
We have created our report header to make the financial report in google data studio elegant.
We have shown that how we can do the formatting of created header in google data studio financial reporting dashboard.
In reference with the page Navigation we have shown you the easy way to link pages and link internal text sources.
We have created 3 pages including Profit & Loss, Balance sheet and cash flow statement.
Link of Google spreadsheet database:
https://docs.google.com/spreadsheets/d/1J5MdDLhwJCDxa6SS4mmuMdzKGuR02RR4hdSfGbCSGo4/edit?usp=sharing
You can access the reports anytime, anywhere by sign in to your google account. Connect the linked sheet with google data studio and work as I explained in this lecture.
Course Requirements:
Should have google chrome
Goggle account
Little bit Knowledge of Excel or Google Spread sheet
Subscribe & share this channel for more videos.
Thanks
#professionalgrooming
Видео Building Financial Dashboard in Google Data Studio | Complete profit & loss report Visualization канала Professional Grooming
Показать
Комментарии отсутствуют
Информация о видео
Другие видео канала
 Profit & Loss Dashboard from Scratch in Google Data Studio 2020
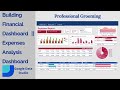 How to make financial dashboard in google data studio | Expenses Analysis Report
 Financial Performance Analytics Dashboard with a products search bar using Excel | Vid. Tutorial #1
 6 advanced techniques in Google Data Studio
 Google Data Studio complete FREE tutorial (2022) - Made for marketers, by marketers.
 Building Financial Dashboard in Google Data Studio | Complete Balance sheet report Visualization
 Create an Awesome Budget Dashboard with Data Studio & Google Sheets | Google Data Studio Tutorial
 Power BI Data Analytics Project: Personal Finance Dashboard
 Business sales report in google data studio | 2020
 Google Data Studio - Build interactive/dynamic Dashboard from Excel data
 Portfolio Tracker Using Google Spreadsheet ( Hindi )
 Excel Dashboard - Plan vs Actual Variances - FREE Download
 Business Intelligence in Google Data Studio - Sales Dashboard Tutorial for Beginners
 Google Data Studio - Data Blending & Calculated Fields | Data Analytics | Railsware Academy
 Asas Google Data Studio - Contoh Bina Dashboard ID DELIMa
 Financial Dashboard in Excel
 How To Build Your Own Stock Portfolio Tracker Dashboard For FREE
 6 FREE Add-Ins for Excel to Start Using Now
 5 Data Studio Functions for Calculated Fields you should know
 How to build Interactive Excel Dashboards that Update with ONE CLICK!