Business Intelligence in Google Data Studio - Sales Dashboard Tutorial for Beginners
Subscribe to our Newsletter and get a FREE Benchmark Analysis Template!
https://magnimetrics.com/newsletter-sign-up/
▬ Video Contents ▬▬▬▬▬▬▬▬▬▬
0:00 - Intro
1:16 - What is Business Intelligence
4:41 - Importing Our Data
9:22 - Interface Overview
18:22 - Fix Dates and Create a Scorecard
27:22 - Add a Date Picker
34:20 - Duplicate KPI's and Change Style
38:36 - Using Custom Fields
40:51 - Adding a Treemap Chart
44:50 - Adding a Time Series Chart
50:33 - Adding a Bar Chart
54:21 - Donut Charts and Drop-downs
1:00:02 - Adding a Google Maps Chart
1:06:12 - Working with Pivot Tables
1:11:21 - Sharing Our Dashboard
1:16:14 - Outro
Visit our website for articles, free Excel models, and Excel training:
https://magnimetrics.com
Automated Financial Analysis. Reinvented.
Read financial analysis stories on our Medium publication:
https://medium.com/magnimetrics
Follow us on social media to be among the first to know when our free beta is open:
LinkedIn | https://www.linkedin.com/company/magnimetrics
Facebook | https://www.facebook.com/Magnimetrics
Twitter | https://twitter.com/magnimetrics
#BusinessIntelligence #GoogleDataStudio #Beginner
Видео Business Intelligence in Google Data Studio - Sales Dashboard Tutorial for Beginners канала Magnimetrics
Показать
Комментарии отсутствуют
Информация о видео
Другие видео канала
![Google Data Studio Tutorial 2021 [For Beginners]](https://i.ytimg.com/vi/LlwotgzaODE/default.jpg) Google Data Studio Tutorial 2021 [For Beginners]
Google Data Studio Tutorial 2021 [For Beginners] Google Sheets Query Function Explained
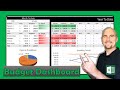 Build Your Own Personal Budget Dashboard | Budget Spreadsheet | Personal Finance
 Get a JOB w/ Google Data Analytics Certificate?!? (ft. Certificate Holders)
 The Exact Funnels I Used to Scale My Agency to 6-Figure Months | Cat Howell, AWeurope 2019
 Microsoft Power BI vs. Google Data Studio | 13 Minute Comparison
 Learn Basic SQL in 15 Minutes | Business Intelligence For Beginners | SQL Tutorial For Beginners
 The Best BI Tool For Beginners? - Google Data Studio Review - Business Intelligence
 Google Sheets BEATS Excel with THESE 10 Features!
![Using Google Data Studio to Create Marketing Report [Free Template Included]](https://i.ytimg.com/vi/eeGYXCpF1Nk/default.jpg) Using Google Data Studio to Create Marketing Report [Free Template Included]
Using Google Data Studio to Create Marketing Report [Free Template Included] Google Data Studio Animated Charts and Other Hidden Data Visualization Components
 Google Sheets - Dashboard Tutorial - Part 1
 Google Data Studio - Data Blending & Calculated Fields | Data Analytics | Railsware Academy
 How to Build a Professional Dashboard in Google Sheets (Query Formula Advanced Course) Step-by-Step
 Use a Google Form to collect information and display it with Data Studio
 Visualizing Geographic Data using Google Data Studio
 Google Data Studio - Dashboard with Calculated Fields Tutorial - Part 1
 What's on my Dashboard? My Business KPIs in Google Data Studio
 Setting Targets in Google Data Studio // How to set targets and benchmarks in your reports
 Google Data Studio complete tutorial (2021) - Made for marketers, by marketers.