How to make financial dashboard in google data studio | Expenses Analysis Report
In this video we are going to see that how we can create a new linked page of only expenses analysis in google data studio financial dashboard.
We have created a time series bar chart to know about the current year expenses and the comparison of old time data in google data studio financial dashboard.
We also created the score cards for comparison of year wise data and month wise data, year wise data was automatically selected according to the data range selection tab and the month wise data selection was custom date selection.
If you are using to compare the figures of different branches then it is better to use Tables instead of Scorecards, for this purpose we have created also table to make the financial dashboard more understandable in google data studio.
In tables you can add as much as you want to add metrics, because it will show its own column in the table to present the data but in this video we have only added a metric of expenses because we were working on only expenses analysis dashboard in google data studio.
After that we have a new chart in our expenses analysis dashboard which is Are chart, to know the volume of revenue by each branch in the specified period to make the report more readable and understandable.
We also have added a pivot table which is showing the data of each month and the totals of by month and branch wise. Pivot table is very useful to see the complete story of the data.
The final chart was our pie chart, which is the most effective tool in our google data studio expenses dashboard, It depicts the data of month wise in percentages, the slice of year wise data and the slice of branch wise expenses data in google data studio financial dashboard. You can add as many metrics in your data to see the different aspects of the report in Google data studio.
Study the following link better that how I have prepared the database in google sheets in accurate form for financial data visualization in google data studio. If the base data correctly sorted then the data visualization will be easy and we can manipulate the data in any form in google data studio to make the financial reports.
Link of Google spreadsheet database:
https://docs.google.com/spreadsheets/d/1JpmIfwfyPgHDN5ERU-zb0Yd0gVo2NAmU5SpQJRC7fbs/edit?usp=sharing
You can access the reports anytime, anywhere by sign in to your google account. Connect the linked sheet with google data studio and work as I explained in this lecture.
Course Requirements:
Should have google chrome
Goggle account
Little bit Knowledge of Excel or Google Spread sheet
Subscribe & share this channel for more videos.
Thanks
#professionalgrooming
P.S. In our coming videos we will do the dashboards of Balance sheet and Cash flow statement.
Видео How to make financial dashboard in google data studio | Expenses Analysis Report канала Professional Grooming
Показать
Комментарии отсутствуют
Информация о видео
Другие видео канала
 Why you don’t get job interview calls
 Complete journal entries of consultant services
 Financial Reporting Dashboard | Assets Analysis | Google Data Studio
 How fresh Graduate Can Get a Job?
 Best Apps for career Development
 how to do bank reconciliation of a small business
 How to identify the fake job advertisement | 2020
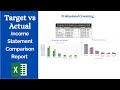 How to prepare projected vs Actual income statement in MS Excel
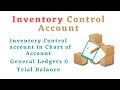 What is inventory control account and how to prepare it?
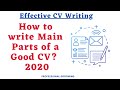 How to write main parts of a good resume
 How to be successful in life | Motivational speech | Motivational Video
 What to do when you are unemployed | 2020
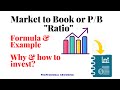 How to calculate Market to Book Value of a Company
 Building a Financial Dashboard in Google Data Studio | (Part-6) | Adding Formula field in GDS
 Cash flow statement | Indirect method example | Cash flow Statement easy explanation
 shab e meraj ki fazilat #islam #islamic #viral
 Building a Financial Dashboard in Google Data Studio | (Part-5) | Formatting & Designing dashboard
 Why do we need to close Temporary Accounts?
 You are the biggest issue in your life - Motivational Speech
 building a financial dashboard in google data studio | (part-2) | Creating data in google sheets