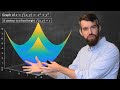
9: Surfaces and Contour Plots - Valuable Vector Calculus
Visualizing functions of two variables is hard because a complete graph would have to be 3-dimensional. The workaround is contour plots!
Full Valuable Vector Calculus playlist: https://www.youtube.com/playlist?list=PLug5ZIRrShJHgsWPng59fFFoqn183aO-1
New math videos every Monday and Friday. Subscribe to make sure you see them!
Видео 9: Surfaces and Contour Plots - Valuable Vector Calculus канала Mu Prime Math
Full Valuable Vector Calculus playlist: https://www.youtube.com/playlist?list=PLug5ZIRrShJHgsWPng59fFFoqn183aO-1
New math videos every Monday and Friday. Subscribe to make sure you see them!
Видео 9: Surfaces and Contour Plots - Valuable Vector Calculus канала Mu Prime Math
Показать
Комментарии отсутствуют
Информация о видео
Другие видео канала
 Visualizing Multi-variable Functions with Contour Plots
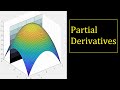 10: Partial Derivatives - Valuable Vector Calculus
 A Concrete Introduction to Tensor Products
 Contour plots | Multivariable calculus | Khan Academy
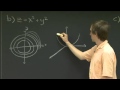 Level curves | MIT 18.02SC Multivariable Calculus, Fall 2010
 Mathcad Prime - Plots: 2D, 3D, Contour & Statistics
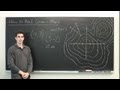 How to Read Contour Intervals : Advanced Math
 Lab09_2: Vector Field
 Plotting Complex Functions - Matlab for Non-Believers
 Contour Lines
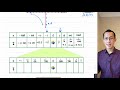 Graphing Rational Functions (1 of 4: Understanding asymptotes)
 creating a contour plot in Origin from a spreadsheet with x,y,z data
 RSM: Introduction to Response Surface Methodology
 How I Got an Internship at TESLA in 5 Steps (easy)!
 Simple Linear Regression: Checking Assumptions with Residual Plots
 Plotting contour maps in MATLAB, Part 1
 What are critical points?
 Section 13.3 Partial Derivatives from a Contour Map
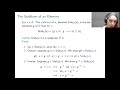 The Orbit-Stabilizer Theorem