Visualizing Multi-variable Functions with Contour Plots
We've seen the graphs of single variable functions like y=x^2 throughout calculus, but now that we are in multivariable calculus and our graphs are of functions like f(x,y)=x^2+y^2 - that is, more than one input - what do they look like? We can use contour plots (sometimes called level curves) to get a nice picture in the two dimensional domain that will help us sketch the three dimensional graph of the function.
****************************************************
YOUR TURN! Learning math requires more than just watching videos, so make sure you reflect, ask questions, and do lots of practice problems!
****************************************************
►Full Multivariable Calculus Playlist: https://www.youtube.com/playlist?list=PLHXZ9OQGMqxc_CvEy7xBKRQr6I214QJcd
****************************************************
Other Course Playlists:
►CALCULUS I: https://www.youtube.com/playlist?list=PLHXZ9OQGMqxfT9RMcReZ4WcoVILP4k6-m
► CALCULUS II: https://www.youtube.com/playlist?list=PLHXZ9OQGMqxc4ySKTIW19TLrT91Ik9M4n
►DISCRETE MATH: https://www.youtube.com/playlist?list=PLHXZ9OQGMqxersk8fUxiUMSIx0DBqsKZS
►LINEAR ALGEBRA: https://www.youtube.com/playlist?list=PLHXZ9OQGMqxfUl0tcqPNTJsb7R6BqSLo6
***************************************************
► Want to learn math effectively? Check out my "Learning Math" Series:
https://www.youtube.com/watch?v=LPH2lqis3D0&list=PLHXZ9OQGMqxfSkRtlL5KPq6JqMNTh_MBw
►Want some cool math? Check out my "Cool Math" Series:
https://www.youtube.com/playlist?list=PLHXZ9OQGMqxelE_9RzwJ-cqfUtaFBpiho
*****************************************************
►Follow me on Twitter: http://twitter.com/treforbazett
*****************************************************
This video was created by Dr. Trefor Bazett
BECOME A MEMBER:
►Join: https://www.youtube.com/channel/UC9rTsvTxJnx1DNrDA3Rqa6A/join
MATH BOOKS & MERCH I LOVE:
► My Amazon Affiliate Shop: https://www.amazon.com/shop/treforbazett
Видео Visualizing Multi-variable Functions with Contour Plots канала Dr. Trefor Bazett
****************************************************
YOUR TURN! Learning math requires more than just watching videos, so make sure you reflect, ask questions, and do lots of practice problems!
****************************************************
►Full Multivariable Calculus Playlist: https://www.youtube.com/playlist?list=PLHXZ9OQGMqxc_CvEy7xBKRQr6I214QJcd
****************************************************
Other Course Playlists:
►CALCULUS I: https://www.youtube.com/playlist?list=PLHXZ9OQGMqxfT9RMcReZ4WcoVILP4k6-m
► CALCULUS II: https://www.youtube.com/playlist?list=PLHXZ9OQGMqxc4ySKTIW19TLrT91Ik9M4n
►DISCRETE MATH: https://www.youtube.com/playlist?list=PLHXZ9OQGMqxersk8fUxiUMSIx0DBqsKZS
►LINEAR ALGEBRA: https://www.youtube.com/playlist?list=PLHXZ9OQGMqxfUl0tcqPNTJsb7R6BqSLo6
***************************************************
► Want to learn math effectively? Check out my "Learning Math" Series:
https://www.youtube.com/watch?v=LPH2lqis3D0&list=PLHXZ9OQGMqxfSkRtlL5KPq6JqMNTh_MBw
►Want some cool math? Check out my "Cool Math" Series:
https://www.youtube.com/playlist?list=PLHXZ9OQGMqxelE_9RzwJ-cqfUtaFBpiho
*****************************************************
►Follow me on Twitter: http://twitter.com/treforbazett
*****************************************************
This video was created by Dr. Trefor Bazett
BECOME A MEMBER:
►Join: https://www.youtube.com/channel/UC9rTsvTxJnx1DNrDA3Rqa6A/join
MATH BOOKS & MERCH I LOVE:
► My Amazon Affiliate Shop: https://www.amazon.com/shop/treforbazett
Видео Visualizing Multi-variable Functions with Contour Plots канала Dr. Trefor Bazett
Показать
Комментарии отсутствуют
Информация о видео
Другие видео канала
 Contour plots | Multivariable calculus | Khan Academy
 Limits are...weird...for multi-variable functions | Limits along paths
 Graphing surfaces | MIT 18.02SC Multivariable Calculus, Fall 2010
 Python Video 07d: Plotting Contour and Surface Plots with Matplotlib
 What are derivatives in 3D? Intro to Partial Derivatives
 The essence of calculus
 What are the big ideas of Multivariable Calculus?? Full Course Intro
 creating a contour plot in Origin from a spreadsheet with x,y,z data
 Double Integration Example over General Regions --- two ways!
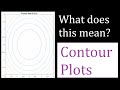 9: Surfaces and Contour Plots - Valuable Vector Calculus
 MATPLOTLIB 3D PLOTS including Scatter 3D and Surface Plots for Matplotlib Python || Matplotlib Tips
 What is Jacobian? | The right way of thinking derivatives and integrals
 Torsion: How curves twist in space, and the TNB or Frenet Frame
 Double Integegration in Polar Coordinates | Example & Derivation
 Computing the Fourier Series of EVEN or ODD Functions **full example**
 Lagrange Multipliers | Geometric Meaning & Full Example
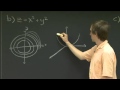 Level curves | MIT 18.02SC Multivariable Calculus, Fall 2010
 Lagrange Multipliers with TWO constraints | Multivariable Optimization
 Change of Variables & The Jacobian | Multi-variable Integration