Mathcad Prime - Plots: 2D, 3D, Contour & Statistics
Empty/Complete Mathcad Worksheet Downloads: https://ln.sync.com/dl/d9c3bb800/b383crjr-ijzb9dd2-et7eu35i-p9hc2vm4
Throughout this webinar, users will learn the pros and cons of different 2D/3D plot types, how plotting compares to using a Chart Component, and how to create various plot types with multiple tracings. Topics to be covered include:
Plotting Data and Functions in 2D
- Cartesian, Polar, Box, Waterfall and Contour Plots
- Multiple traces in 2D
- 2D plot formatting
- Using units with 2D plots
Plotting Data and Functions in 3D
- Multiple traces and data points in 3D
- 3D plot formatting
- Using units with 3D plots
By the end of this webinar, users will be able to create plots, format and add units to them. Users will also feel comfortable knowing which kind of plot works best in each situation.
Have questions? Email your question to info@tech-30.com and we will reply as soon as possible.
Check out Tech-30.com for exclusive free events, promotions and PTC software discounts.
Видео Mathcad Prime - Plots: 2D, 3D, Contour & Statistics канала Tech-30
Показать
Комментарии отсутствуют
Информация о видео
Другие видео канала
 2014 11 19 Mathcad Given, Find, Solve
![How to Create Map in ArcGIS Pro 2.6 - ||Speak Khmer|| - [Khmer GIS Academy]](https://i.ytimg.com/vi/DG2xrJS4adk/default.jpg) How to Create Map in ArcGIS Pro 2.6 - ||Speak Khmer|| - [Khmer GIS Academy]
How to Create Map in ArcGIS Pro 2.6 - ||Speak Khmer|| - [Khmer GIS Academy] Load Shear Moment Diagram with Mathcad.avi
 Mathcad Basics Webinar: Worksheet Creation and Calculation Management
 Using Excel with PTC Mathcad Prime Webinar
 Engineering Calculations with PTC Mathcad Prime
 Units, 3D Plots and Matrices in Mathcad
 Natural Frequencies of a Building using Mathcad
 PTC Creo Webinar: Advanced Framework Extension (AFX)
 Haz tu celular 2 veces más rápido en menos de 1 Minuto
 Masonry CMU Design Tutorial + Summary Sheets + Worksheets
 SAUDA KHARA KHARA | BHANGRA DANCE | Shivani Bhagwan and Chaya Kumar | Diljit Dosanjh | Good Newwz
 Comparing Mathcad 15 to Mathcad Prime Webinar
 X Y Z into 3D Surface Graph in Microsoft Excel with XYZ Mesh v4
 Why Mathcad Users are Moving to Maple
![PTC Mathcad Tutorial - Basic Math and Text [Introduction]](https://i.ytimg.com/vi/yaA7iG7NTx0/default.jpg) PTC Mathcad Tutorial - Basic Math and Text [Introduction]
PTC Mathcad Tutorial - Basic Math and Text [Introduction] Creo 6 0 Topology Optimization
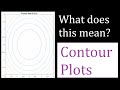 9: Surfaces and Contour Plots - Valuable Vector Calculus
 Heat Transfer L13 p2 - Excel Solver - Simple Boundary Conditions
 Learn PTC Mathcad Prime 7 with 3 Examples under 9 minutes #boldlearning