- Популярные видео
- Авто
- Видео-блоги
- ДТП, аварии
- Для маленьких
- Еда, напитки
- Животные
- Закон и право
- Знаменитости
- Игры
- Искусство
- Комедии
- Красота, мода
- Кулинария, рецепты
- Люди
- Мото
- Музыка
- Мультфильмы
- Наука, технологии
- Новости
- Образование
- Политика
- Праздники
- Приколы
- Природа
- Происшествия
- Путешествия
- Развлечения
- Ржач
- Семья
- Сериалы
- Спорт
- Стиль жизни
- ТВ передачи
- Танцы
- Технологии
- Товары
- Ужасы
- Фильмы
- Шоу-бизнес
- Юмор
Create Workflow Calendar Chart in Excel | Track Project Progress Dynamically
https://www.other-levels.com
🌍 🏅 The #1 Website Worldwide for Excel Dashboard Templates, Reports, and Professional Analysis Tools.
🎖️ 🏆 Other Levels YouTube Channel — The #1 Authority for Excel Dashboards on YouTube, with over 24 million views and a global impact.
💼 Other Levels Services
* Custom Excel Dashboard Service https://other-levels.com/products/custom-excel-dashboard-service
* Enhance Your Templates Service https://other-levels.com/products/enhance-your-templates-service
🎓 Master Excel Dashboards
Join over 100,000 learners in our top-rated online course and gain the skills to create professional Excel dashboards from scratch.
👉 Enroll today: https://other-levels.com/products/master-microsoft-excel-dashboards-online-course
To watch the full Tutorials? Join our channel Membership https://www.youtube.com/channel/UCuDF09RGFE3V3lY77Z_cA9g/join
🎓 Free Excel Courses On YouTube:
Single Dynamic Excel Dashboard https://www.youtube.com/playlist?list=PLxuBYEpUjhDsVA2O1FTayFiYrDfoErdbx
Multiple Dynamic Excel Dashboards https://www.youtube.com/playlist?list=PLxuBYEpUjhDuAfwWMEgnYirso6UXMzPB9
Have a question about this template?
👇🏻Comment down below
Let’s connect on social
LinkedIn https://www.linkedin.com/company/other-levels-com
Facebook https://www.facebook.com/Other.levels.Official
Instagram https://www.instagram.com/other.levels
TikTok https://www.tiktok.com/@other.levels
🎯 Playlists:
Data Analysis By Power Point https://youtube.com/watch
PowerPoint Slides https://youtube.com/watch
CV/Resume Templates https://youtube.com/watch
Organizational Structure Chart https://www.youtube.com/watch
PowerPoint Templates https://youtube.com/watch
PowerPoint Dashboard https://youtube.com/watch
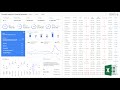
Modern Excel Reports https://youtube.com/watch
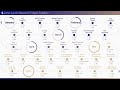
Workflow Calendar Chart – Excel Project Tracker
This Excel dashboard template is designed to help you manage tasks, monitor project completion, and visualize timelines across all 53 weeks of the year. It's ideal for teams, project managers, and Excel learners building real-time progress charts.
Key Dashboard Highlights
• Dynamic Workflow Calendar (Auto-Highlights Task Duration)
• Project Start Date & Week Logic (Auto Calculated)
• Task Process % with Bar Visualization
• Conditional Formatting Based on Date Ranges
• Navigation Buttons to Switch Between Projects
• Task Fields: Title, Responsibility, Duration, Status
• Dynamic Search Bar for Filtering Tasks
• Supports Up to 53 Weeks Per Year
• Fully Interactive & 100% Excel Formula-Based — No Macros
Key Excel Features Used
• Conditional Formatting
• Cell Linking with Dates
• Custom Number Formats
• Navigation via Hyperlinks
• Weekly Auto-Incremented Timeline
• Search & Filter Functionalities
• Bar Charts for Task Completion %
• Structured Sheets for Multiple Projects
🎯 Best For:
• Project managers managing weekly deliverables
• Excel learners mastering real dashboards
• Teams visualizing cross-project task flows
• Freelancers or agencies building Excel automation reports
Included Dataset Fields
• Project Name, Start Date, Task Titles, Responsibilities
• Duration, Start/End Dates, Task Status, Task Completion %
• 53-Week Calendar Layout with Auto-Highlighting
🔔 Found this tutorial helpful?
Give it a like, drop a comment, and subscribe to the channel for more Excel dashboard guides.
00:00 Welcome to Other Levels
00:15 What You’ll Learn in This Video
00:35 Key Features of the Excel Workflow Tracker
01:00 Project Info: Name, Start Date & Completion %
01:25 Task Management Fields Explained
01:50 Dynamic Search Bar for Tasks
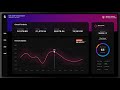
02:10 Progress Bar Chart Based on Task Completion
02:40 Workflow Calendar Overview – 53 Weeks View
03:00 Start Week Insights (Day Number & Name)
03:20 Project Duration Line Chart
03:40 Multi-Project Navigation (5 Projects Setup)
04:00 Left-Side Navigation Buttons
04:15 Why This Template Matters in Project Tracking
04:40 Data Entry Simplicity – Just Fill Your Info
05:00 Where to Learn Design & Template Creation
05:20 Creating the Visual Progress Bar Formula
05:50 Filled vs Empty Circles Logic
06:10 Setting Up the Status Column
06:30 Adding Data Validation for Status Dropdown
06:50 Conditional Formatting by Status Type
07:20 Final Look: Color-Coded Status Labels
07:40 What’s Next: Workflow Calendar & Hyperlinks
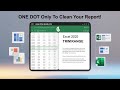
07:55 Download Templates from other-levels.com
#WorkflowChart #ExcelDashboard #ProjectTracker #CalendarChart #ExcelTemplates #TaskManagement #ExcelAutomation #OtherLevels
Видео Create Workflow Calendar Chart in Excel | Track Project Progress Dynamically канала Other Level’s
🌍 🏅 The #1 Website Worldwide for Excel Dashboard Templates, Reports, and Professional Analysis Tools.
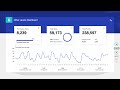
🎖️ 🏆 Other Levels YouTube Channel — The #1 Authority for Excel Dashboards on YouTube, with over 24 million views and a global impact.
💼 Other Levels Services
* Custom Excel Dashboard Service https://other-levels.com/products/custom-excel-dashboard-service
* Enhance Your Templates Service https://other-levels.com/products/enhance-your-templates-service
🎓 Master Excel Dashboards
Join over 100,000 learners in our top-rated online course and gain the skills to create professional Excel dashboards from scratch.
👉 Enroll today: https://other-levels.com/products/master-microsoft-excel-dashboards-online-course
To watch the full Tutorials? Join our channel Membership https://www.youtube.com/channel/UCuDF09RGFE3V3lY77Z_cA9g/join
🎓 Free Excel Courses On YouTube:
Single Dynamic Excel Dashboard https://www.youtube.com/playlist?list=PLxuBYEpUjhDsVA2O1FTayFiYrDfoErdbx
Multiple Dynamic Excel Dashboards https://www.youtube.com/playlist?list=PLxuBYEpUjhDuAfwWMEgnYirso6UXMzPB9
Have a question about this template?
👇🏻Comment down below
Let’s connect on social
LinkedIn https://www.linkedin.com/company/other-levels-com
Facebook https://www.facebook.com/Other.levels.Official
Instagram https://www.instagram.com/other.levels
TikTok https://www.tiktok.com/@other.levels
🎯 Playlists:
Data Analysis By Power Point https://youtube.com/watch
PowerPoint Slides https://youtube.com/watch
CV/Resume Templates https://youtube.com/watch
Organizational Structure Chart https://www.youtube.com/watch
PowerPoint Templates https://youtube.com/watch
PowerPoint Dashboard https://youtube.com/watch
Modern Excel Reports https://youtube.com/watch
Workflow Calendar Chart – Excel Project Tracker
This Excel dashboard template is designed to help you manage tasks, monitor project completion, and visualize timelines across all 53 weeks of the year. It's ideal for teams, project managers, and Excel learners building real-time progress charts.
Key Dashboard Highlights
• Dynamic Workflow Calendar (Auto-Highlights Task Duration)
• Project Start Date & Week Logic (Auto Calculated)
• Task Process % with Bar Visualization
• Conditional Formatting Based on Date Ranges
• Navigation Buttons to Switch Between Projects
• Task Fields: Title, Responsibility, Duration, Status
• Dynamic Search Bar for Filtering Tasks
• Supports Up to 53 Weeks Per Year
• Fully Interactive & 100% Excel Formula-Based — No Macros
Key Excel Features Used
• Conditional Formatting
• Cell Linking with Dates
• Custom Number Formats
• Navigation via Hyperlinks
• Weekly Auto-Incremented Timeline
• Search & Filter Functionalities
• Bar Charts for Task Completion %
• Structured Sheets for Multiple Projects
🎯 Best For:
• Project managers managing weekly deliverables
• Excel learners mastering real dashboards
• Teams visualizing cross-project task flows
• Freelancers or agencies building Excel automation reports
Included Dataset Fields
• Project Name, Start Date, Task Titles, Responsibilities
• Duration, Start/End Dates, Task Status, Task Completion %
• 53-Week Calendar Layout with Auto-Highlighting
🔔 Found this tutorial helpful?
Give it a like, drop a comment, and subscribe to the channel for more Excel dashboard guides.
00:00 Welcome to Other Levels
00:15 What You’ll Learn in This Video
00:35 Key Features of the Excel Workflow Tracker
01:00 Project Info: Name, Start Date & Completion %
01:25 Task Management Fields Explained
01:50 Dynamic Search Bar for Tasks
02:10 Progress Bar Chart Based on Task Completion
02:40 Workflow Calendar Overview – 53 Weeks View
03:00 Start Week Insights (Day Number & Name)
03:20 Project Duration Line Chart
03:40 Multi-Project Navigation (5 Projects Setup)
04:00 Left-Side Navigation Buttons
04:15 Why This Template Matters in Project Tracking
04:40 Data Entry Simplicity – Just Fill Your Info
05:00 Where to Learn Design & Template Creation
05:20 Creating the Visual Progress Bar Formula
05:50 Filled vs Empty Circles Logic
06:10 Setting Up the Status Column
06:30 Adding Data Validation for Status Dropdown
06:50 Conditional Formatting by Status Type
07:20 Final Look: Color-Coded Status Labels
07:40 What’s Next: Workflow Calendar & Hyperlinks
07:55 Download Templates from other-levels.com
#WorkflowChart #ExcelDashboard #ProjectTracker #CalendarChart #ExcelTemplates #TaskManagement #ExcelAutomation #OtherLevels
Видео Create Workflow Calendar Chart in Excel | Track Project Progress Dynamically канала Other Level’s
workflow calendar chart excel project tracker excel dashboard dynamic calendar chart excel weekly project planner excel excel workflow chart how to create workflow calendar in excel conditional formatting task calendar weekly project timeline excel gantt chart weekly view excel track project progress in excel task calendar in excel excel task management chart excel calendar by weeks project calendar tracker template excel calendar automation
Комментарии отсутствуют
Информация о видео
7 мая 2025 г. 19:01:17
00:08:02
Другие видео канала