- Популярные видео
- Авто
- Видео-блоги
- ДТП, аварии
- Для маленьких
- Еда, напитки
- Животные
- Закон и право
- Знаменитости
- Игры
- Искусство
- Комедии
- Красота, мода
- Кулинария, рецепты
- Люди
- Мото
- Музыка
- Мультфильмы
- Наука, технологии
- Новости
- Образование
- Политика
- Праздники
- Приколы
- Природа
- Происшествия
- Путешествия
- Развлечения
- Ржач
- Семья
- Сериалы
- Спорт
- Стиль жизни
- ТВ передачи
- Танцы
- Технологии
- Товары
- Ужасы
- Фильмы
- Шоу-бизнес
- Юмор
Track Sales and Orders - Executive Summary Excel Dashboard
https://www.other-levels.com
🌍 🏅 The #1 Website Worldwide for Excel Dashboard Templates, Reports, and Professional Analysis Tools.
🎖️ 🏆 Other Levels YouTube Channel — The #1 Authority for Excel Dashboards on YouTube, with over 24 million views and a global impact.
💼 Other Levels Services
* Custom Excel Dashboard Service https://other-levels.com/products/custom-excel-dashboard-service
* Enhance Your Templates Service https://other-levels.com/products/enhance-your-templates-service
🎓 Master Excel Dashboards
Join over 100,000 learners in our top-rated online course and gain the skills to create professional Excel dashboards from scratch.
👉 Enroll today: https://other-levels.com/products/master-microsoft-excel-dashboards-online-course
To watch the full Tutorials? Join our channel Membership https://www.youtube.com/channel/UCuDF09RGFE3V3lY77Z_cA9g/join
🎓 Free Excel Courses On YouTube:
Single Dynamic Excel Dashboard https://www.youtube.com/playlist?list=PLxuBYEpUjhDsVA2O1FTayFiYrDfoErdbx
Multiple Dynamic Excel Dashboards https://www.youtube.com/playlist?list=PLxuBYEpUjhDuAfwWMEgnYirso6UXMzPB9
Have a question about this template?
👇🏻Comment down below
Let’s connect on social
LinkedIn https://www.linkedin.com/company/other-levels-com
Facebook https://www.facebook.com/Other.levels.Official
Instagram https://www.instagram.com/other.levels
TikTok https://www.tiktok.com/@other.levels
Playlists
Data Analysis By Power Point https://youtube.com/watch
PowerPoint Slides https://youtube.com/watch
CV/Resume Templates https://youtube.com/watch
Organizational Structure Chart https://www.youtube.com/watch
PowerPoint Templates https://youtube.com/watch
PowerPoint Dashboard https://youtube.com/watch
Modern Excel Reports https://youtube.com/watch
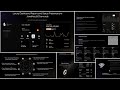
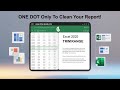
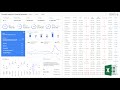
⭐️ Take control of your data with the Comprehensive Executive Summary Excel Dashboard — a modern and powerful solution designed to deliver business insights at a glance.
Whether you're managing KPIs for sales, social media, store visits, or purchase orders, this dashboard brings everything together in a sleek and dynamic Excel interface.
Built for executives, business analysts, marketers, and entrepreneurs, this all-in-one Excel dashboard features two interconnected reporting pages with interactive buttons, slicers, and advanced visualizations.
📊 First Dashboard – Business Overview Highlights:
- Social Media Analytics – Track growth on Facebook, Twitter, YouTube & Instagram
- Store Visit Analysis – Geographic heatmaps for visits by country and city
- YOY Performance Metrics – Compare current and previous years for visits & sales
- Net Profit Insights – Monthly radar charts & cumulative retained earnings
- Sales Analysis – Monthly & brand-wise trends with comparison ratios
- Slicers for Month and Country – Filter and interact easily
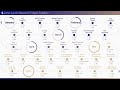
- Second Dashboard – Orders & Marketing Insights:
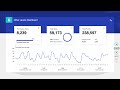
- Purchase Orders Tracking – Monitor total orders, refunds & average order value
- Top Products Funnel Chart – See what drives the most units sold
- Returning Customer Trend – Measure loyalty over time with YOY comparisons
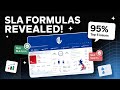
- Advertising Campaign Performance – Line charts for campaign effectiveness
- Ad Creator Filter & Country Slicer – Deep-dive by marketer or region
Full Data Table Includes:
Brand, Location, Sales, Orders, Refunds, Social Media Stats, Campaign Data, Customer Rates & More.
Why Choose This Excel Dashboard?
No coding required
Clean Mac-style visuals & fully dynamic interface
Real-time business performance tracking
Interactive buttons for seamless navigation
Perfect for daily, weekly, and monthly reporting
Ideal for:
C-level Executives
Marketing Analysts
eCommerce Managers
Business Consultants
Retail Chain Owners
00:00 Start Executive Summary Dashboard (Excel)
00:24 Create Daily & Monthly Profit Radar Charts
01:03 Build Pivot Tables for 2022 & 2023 Profits
01:21 Insert and Format Dual-Year Radar Charts
03:09 Design Center Circle and White Ring in Excel
04:15 Add Month Labels Around the Circular Chart
06:12 Display 2023 Total Profits in Center
07:39 Add Custom Circular Gridlines
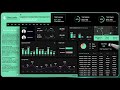
09:30 Design Strategic Plans Section (Business, Ads)
10:19 Use Excel Formulas to Allocate Profits by %
10:50 Link Strategy Amounts, Descriptions & Values
12:00 Create Orders & Returns Analysis (2023)
12:28 Insert and Format 2D Column Chart
13:36 Style Column Chart for Dark Theme Look
15:01 Compare 2022 vs. 2023 Orders with Excel Formula
16:24 Add Total Orders, Refunds, and Descriptions
18:03 Show Completed vs. Refunded Orders
19:18 Add Chart Legend and Ratio Calculations
21:19 Calculate Average Order Value
22:26 Finalize Pivot Table Layout
22:40 Protect and Lock Dashboard Elements
24:15 Use Sheet Protection to Secure Dashboard
#ExecutiveDashboard #ExcelDashboard #BusinessAnalytics #ExcelTips #DataVisualization #ExcelReporting #DashboardDesign #PowerfulExcel #OtherLevels #ExcelMarketingDashboard
Видео Track Sales and Orders - Executive Summary Excel Dashboard канала Other Level’s
🌍 🏅 The #1 Website Worldwide for Excel Dashboard Templates, Reports, and Professional Analysis Tools.
🎖️ 🏆 Other Levels YouTube Channel — The #1 Authority for Excel Dashboards on YouTube, with over 24 million views and a global impact.
💼 Other Levels Services
* Custom Excel Dashboard Service https://other-levels.com/products/custom-excel-dashboard-service
* Enhance Your Templates Service https://other-levels.com/products/enhance-your-templates-service
🎓 Master Excel Dashboards
Join over 100,000 learners in our top-rated online course and gain the skills to create professional Excel dashboards from scratch.
👉 Enroll today: https://other-levels.com/products/master-microsoft-excel-dashboards-online-course
To watch the full Tutorials? Join our channel Membership https://www.youtube.com/channel/UCuDF09RGFE3V3lY77Z_cA9g/join
🎓 Free Excel Courses On YouTube:
Single Dynamic Excel Dashboard https://www.youtube.com/playlist?list=PLxuBYEpUjhDsVA2O1FTayFiYrDfoErdbx
Multiple Dynamic Excel Dashboards https://www.youtube.com/playlist?list=PLxuBYEpUjhDuAfwWMEgnYirso6UXMzPB9
Have a question about this template?
👇🏻Comment down below
Let’s connect on social
LinkedIn https://www.linkedin.com/company/other-levels-com
Facebook https://www.facebook.com/Other.levels.Official
Instagram https://www.instagram.com/other.levels
TikTok https://www.tiktok.com/@other.levels
Playlists
Data Analysis By Power Point https://youtube.com/watch
PowerPoint Slides https://youtube.com/watch
CV/Resume Templates https://youtube.com/watch
Organizational Structure Chart https://www.youtube.com/watch
PowerPoint Templates https://youtube.com/watch
PowerPoint Dashboard https://youtube.com/watch
Modern Excel Reports https://youtube.com/watch
⭐️ Take control of your data with the Comprehensive Executive Summary Excel Dashboard — a modern and powerful solution designed to deliver business insights at a glance.
Whether you're managing KPIs for sales, social media, store visits, or purchase orders, this dashboard brings everything together in a sleek and dynamic Excel interface.
Built for executives, business analysts, marketers, and entrepreneurs, this all-in-one Excel dashboard features two interconnected reporting pages with interactive buttons, slicers, and advanced visualizations.
📊 First Dashboard – Business Overview Highlights:
- Social Media Analytics – Track growth on Facebook, Twitter, YouTube & Instagram
- Store Visit Analysis – Geographic heatmaps for visits by country and city
- YOY Performance Metrics – Compare current and previous years for visits & sales
- Net Profit Insights – Monthly radar charts & cumulative retained earnings
- Sales Analysis – Monthly & brand-wise trends with comparison ratios
- Slicers for Month and Country – Filter and interact easily
- Second Dashboard – Orders & Marketing Insights:
- Purchase Orders Tracking – Monitor total orders, refunds & average order value
- Top Products Funnel Chart – See what drives the most units sold
- Returning Customer Trend – Measure loyalty over time with YOY comparisons
- Advertising Campaign Performance – Line charts for campaign effectiveness
- Ad Creator Filter & Country Slicer – Deep-dive by marketer or region
Full Data Table Includes:
Brand, Location, Sales, Orders, Refunds, Social Media Stats, Campaign Data, Customer Rates & More.
Why Choose This Excel Dashboard?
No coding required
Clean Mac-style visuals & fully dynamic interface
Real-time business performance tracking
Interactive buttons for seamless navigation
Perfect for daily, weekly, and monthly reporting
Ideal for:
C-level Executives
Marketing Analysts
eCommerce Managers
Business Consultants
Retail Chain Owners
00:00 Start Executive Summary Dashboard (Excel)
00:24 Create Daily & Monthly Profit Radar Charts
01:03 Build Pivot Tables for 2022 & 2023 Profits
01:21 Insert and Format Dual-Year Radar Charts
03:09 Design Center Circle and White Ring in Excel
04:15 Add Month Labels Around the Circular Chart
06:12 Display 2023 Total Profits in Center
07:39 Add Custom Circular Gridlines
09:30 Design Strategic Plans Section (Business, Ads)
10:19 Use Excel Formulas to Allocate Profits by %
10:50 Link Strategy Amounts, Descriptions & Values
12:00 Create Orders & Returns Analysis (2023)
12:28 Insert and Format 2D Column Chart
13:36 Style Column Chart for Dark Theme Look
15:01 Compare 2022 vs. 2023 Orders with Excel Formula
16:24 Add Total Orders, Refunds, and Descriptions
18:03 Show Completed vs. Refunded Orders
19:18 Add Chart Legend and Ratio Calculations
21:19 Calculate Average Order Value
22:26 Finalize Pivot Table Layout
22:40 Protect and Lock Dashboard Elements
24:15 Use Sheet Protection to Secure Dashboard
#ExecutiveDashboard #ExcelDashboard #BusinessAnalytics #ExcelTips #DataVisualization #ExcelReporting #DashboardDesign #PowerfulExcel #OtherLevels #ExcelMarketingDashboard
Видео Track Sales and Orders - Executive Summary Excel Dashboard канала Other Level’s
Executive Dashboard Excel Executive Dashboard Excel Dashboard Tutorial Business Dashboard Excel Sales Dashboard Excel Social Media Excel Dashboard KPI Dashboard Excel Dashboard No VBA Excel Data Visualization Dashboard with Slicers Purchase Order Tracker Excel Store Visits Analysis Excel Excel Map Chart Excel Funnel Chart Excel for Business Marketing Dashboard Excel Excel Executive Report Excel Interactive Dashboard
Комментарии отсутствуют
Информация о видео
9 января 2023 г. 13:53:20
00:36:52
Другие видео канала