- Популярные видео
- Авто
- Видео-блоги
- ДТП, аварии
- Для маленьких
- Еда, напитки
- Животные
- Закон и право
- Знаменитости
- Игры
- Искусство
- Комедии
- Красота, мода
- Кулинария, рецепты
- Люди
- Мото
- Музыка
- Мультфильмы
- Наука, технологии
- Новости
- Образование
- Политика
- Праздники
- Приколы
- Природа
- Происшествия
- Путешествия
- Развлечения
- Ржач
- Семья
- Сериалы
- Спорт
- Стиль жизни
- ТВ передачи
- Танцы
- Технологии
- Товары
- Ужасы
- Фильмы
- Шоу-бизнес
- Юмор
These Sales Metrics Separate Leaders From Laggards
https://www.other-levels.com
🌍 🏅 The #1 Website Worldwide for Excel Dashboard Templates, Reports, and Professional Analysis Tools.
🎖️ 🏆 Other Levels YouTube Channel — The #1 Authority for Excel Dashboards on YouTube, with over 24 million views and a global impact.
💼 Other Levels Services
* Custom Excel Dashboard Service https://other-levels.com/products/custom-excel-dashboard-service
* Enhance Your Templates Service https://other-levels.com/products/enhance-your-templates-service
🎓 Master Excel Dashboards
Join over 100,000 learners in our top-rated online course and gain the skills to create professional Excel dashboards from scratch.
👉 Enroll today: https://other-levels.com/products/master-microsoft-excel-dashboards-online-course
To watch the full Tutorials? Join our channel Membership https://www.youtube.com/channel/UCuDF09RGFE3V3lY77Z_cA9g/join
🎓 Free Excel Courses On YouTube:
Single Dynamic Excel Dashboard https://www.youtube.com/playlist?list=PLxuBYEpUjhDsVA2O1FTayFiYrDfoErdbx
Multiple Dynamic Excel Dashboards https://www.youtube.com/playlist?list=PLxuBYEpUjhDuAfwWMEgnYirso6UXMzPB9
Have a question about this template?
👇🏻Comment down below
Let’s connect on social
LinkedIn https://www.linkedin.com/company/other-levels-com
Facebook https://www.facebook.com/Other.levels.Official
Instagram https://www.instagram.com/other.levels
TikTok https://www.tiktok.com/@other.levels
Playlists
Data Analysis By Power Point https://youtube.com/watch
PowerPoint Slides https://youtube.com/watch
CV/Resume Templates https://youtube.com/watch
Organizational Structure Chart https://www.youtube.com/watch
PowerPoint Templates https://youtube.com/watch
PowerPoint Dashboard https://youtube.com/watch
Modern Excel Reports https://youtube.com/watch
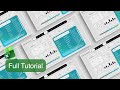
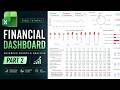
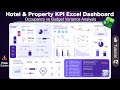
⭐️ Build a Dynamic Sales Growth & Net Profit Margin Dashboard in Excel
Turn Sales Data into Strategy — in Just 5 Simple Steps
Looking to boost your business performance with data-driven insights? In this tutorial, we’ll walk you through five easy steps to create a powerful Sales Growth and Net Profit Margin Dashboard using Microsoft Excel — ideal for sales managers, analysts, and business owners.
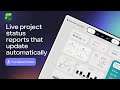
This hands-on tutorial will help you design a clean, interactive dashboard that transforms raw sales data into strategic insights — without any coding required.
⸻
What You’ll Learn
This advanced Excel dashboard will enable you to:
• Track total sales, purchase returns, and final profits
• View performance by branch and by sales representative
• Monitor weekly trends with line charts for purchases, sales, and profits
• Analyze quarterly performance for strategic planning
• Visualize net profit margins and uncover growth opportunities
⸻
Key Features
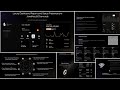
• Purchases and returns tracking
• Total sales overview with dynamic KPIs
• Final profit margin calculation and visualization
• Sales breakdown by branch and representative
• Weekly performance line charts
• Quarterly analysis summary table
• Fully dynamic layout using PivotTables and slicers
• Clean, professional design — no coding required
⸻
Who Is This For?
• Sales managers
• Business analysts
• Small business owners
• Operations and finance teams
• Anyone looking to visualize and improve sales performance
⸻
Want More?
Join our Channel Membership to unlock:
• Premium Excel dashboard templates
• Step-by-step video tutorials
• Members-only resources and support
⸻
Found This Helpful?
• Like the video
• Share your questions or feedback in the comments
• Subscribe to Other Levels for expert Excel tutorials and dashboard creation guides
Let’s bring clarity to your sales strategy — one dashboard at a time.
#SalesDashboard #ExcelDashboard #NetProfitMargin #SalesGrowthExcel #DynamicDashboard #BusinessAnalytics #OtherLevels #SalesAnalysis #DashboardDesign #ExcelTips
Видео These Sales Metrics Separate Leaders From Laggards канала Other Level’s
🌍 🏅 The #1 Website Worldwide for Excel Dashboard Templates, Reports, and Professional Analysis Tools.
🎖️ 🏆 Other Levels YouTube Channel — The #1 Authority for Excel Dashboards on YouTube, with over 24 million views and a global impact.
💼 Other Levels Services
* Custom Excel Dashboard Service https://other-levels.com/products/custom-excel-dashboard-service
* Enhance Your Templates Service https://other-levels.com/products/enhance-your-templates-service
🎓 Master Excel Dashboards
Join over 100,000 learners in our top-rated online course and gain the skills to create professional Excel dashboards from scratch.
👉 Enroll today: https://other-levels.com/products/master-microsoft-excel-dashboards-online-course
To watch the full Tutorials? Join our channel Membership https://www.youtube.com/channel/UCuDF09RGFE3V3lY77Z_cA9g/join
🎓 Free Excel Courses On YouTube:
Single Dynamic Excel Dashboard https://www.youtube.com/playlist?list=PLxuBYEpUjhDsVA2O1FTayFiYrDfoErdbx
Multiple Dynamic Excel Dashboards https://www.youtube.com/playlist?list=PLxuBYEpUjhDuAfwWMEgnYirso6UXMzPB9
Have a question about this template?
👇🏻Comment down below
Let’s connect on social
LinkedIn https://www.linkedin.com/company/other-levels-com
Facebook https://www.facebook.com/Other.levels.Official
Instagram https://www.instagram.com/other.levels
TikTok https://www.tiktok.com/@other.levels
Playlists
Data Analysis By Power Point https://youtube.com/watch
PowerPoint Slides https://youtube.com/watch
CV/Resume Templates https://youtube.com/watch
Organizational Structure Chart https://www.youtube.com/watch
PowerPoint Templates https://youtube.com/watch
PowerPoint Dashboard https://youtube.com/watch
Modern Excel Reports https://youtube.com/watch
⭐️ Build a Dynamic Sales Growth & Net Profit Margin Dashboard in Excel
Turn Sales Data into Strategy — in Just 5 Simple Steps
Looking to boost your business performance with data-driven insights? In this tutorial, we’ll walk you through five easy steps to create a powerful Sales Growth and Net Profit Margin Dashboard using Microsoft Excel — ideal for sales managers, analysts, and business owners.
This hands-on tutorial will help you design a clean, interactive dashboard that transforms raw sales data into strategic insights — without any coding required.
⸻
What You’ll Learn
This advanced Excel dashboard will enable you to:
• Track total sales, purchase returns, and final profits
• View performance by branch and by sales representative
• Monitor weekly trends with line charts for purchases, sales, and profits
• Analyze quarterly performance for strategic planning
• Visualize net profit margins and uncover growth opportunities
⸻
Key Features
• Purchases and returns tracking
• Total sales overview with dynamic KPIs
• Final profit margin calculation and visualization
• Sales breakdown by branch and representative
• Weekly performance line charts
• Quarterly analysis summary table
• Fully dynamic layout using PivotTables and slicers
• Clean, professional design — no coding required
⸻
Who Is This For?
• Sales managers
• Business analysts
• Small business owners
• Operations and finance teams
• Anyone looking to visualize and improve sales performance
⸻
Want More?
Join our Channel Membership to unlock:
• Premium Excel dashboard templates
• Step-by-step video tutorials
• Members-only resources and support
⸻
Found This Helpful?
• Like the video
• Share your questions or feedback in the comments
• Subscribe to Other Levels for expert Excel tutorials and dashboard creation guides
Let’s bring clarity to your sales strategy — one dashboard at a time.
#SalesDashboard #ExcelDashboard #NetProfitMargin #SalesGrowthExcel #DynamicDashboard #BusinessAnalytics #OtherLevels #SalesAnalysis #DashboardDesign #ExcelTips
Видео These Sales Metrics Separate Leaders From Laggards канала Other Level’s
create dashboard in excel dashboard best practices dashboard design dashboard excel dashboard setup data analytics data insights data tracking tools data visualization excel excel dashboard excel dashboard tutorial excel formulas excel metrics excel sales dashboard tutorial metrics dashboard ms excel other levels other-levels.com performance tracking sales analytics sales insights dashboard sales performance metrics sales reporting tool sales tools
Комментарии отсутствуют
Информация о видео
22 июня 2023 г. 18:49:26
00:20:47
Другие видео канала