- Популярные видео
- Авто
- Видео-блоги
- ДТП, аварии
- Для маленьких
- Еда, напитки
- Животные
- Закон и право
- Знаменитости
- Игры
- Искусство
- Комедии
- Красота, мода
- Кулинария, рецепты
- Люди
- Мото
- Музыка
- Мультфильмы
- Наука, технологии
- Новости
- Образование
- Политика
- Праздники
- Приколы
- Природа
- Происшествия
- Путешествия
- Развлечения
- Ржач
- Семья
- Сериалы
- Спорт
- Стиль жизни
- ТВ передачи
- Танцы
- Технологии
- Товары
- Ужасы
- Фильмы
- Шоу-бизнес
- Юмор
Excel project for data analyst | dashboard excel | advance #excel | Conditional Formatting
https://www.other-levels.com
🌍 🏅 The #1 Website Worldwide for Excel Dashboard Templates, Reports, and Professional Analysis Tools.
🎖️ 🏆 Other Levels YouTube Channel — The #1 Authority for Excel Dashboards on YouTube, with over 24 million views and a global impact.
💼 Other Levels Services
* Custom Excel Dashboard Service https://other-levels.com/products/custom-excel-dashboard-service
* Enhance Your Templates Service https://other-levels.com/products/enhance-your-templates-service
🎓 Master Excel Dashboards
Join over 100,000 learners in our top-rated online course and gain the skills to create professional Excel dashboards from scratch.
👉 Enroll today: https://other-levels.com/products/master-microsoft-excel-dashboards-online-course
To watch the full Tutorials? Join our channel Membership https://www.youtube.com/channel/UCuDF09RGFE3V3lY77Z_cA9g/join
🎓 Free Excel Courses On YouTube:
Single Dynamic Excel Dashboard https://www.youtube.com/playlist?list=PLxuBYEpUjhDsVA2O1FTayFiYrDfoErdbx
Multiple Dynamic Excel Dashboards https://www.youtube.com/playlist?list=PLxuBYEpUjhDuAfwWMEgnYirso6UXMzPB9
Have a question about this template?
👇🏻Comment down below
Let’s connect on social
LinkedIn https://www.linkedin.com/company/other-levels-com
Facebook https://www.facebook.com/Other.levels.Official
Instagram https://www.instagram.com/other.levels
TikTok https://www.tiktok.com/@other.levels
Playlists
Data Analysis By Power Point https://youtube.com/watch
PowerPoint Slides https://youtube.com/watch
CV/Resume Templates https://youtube.com/watch
Organizational Structure Chart https://www.youtube.com/watch
PowerPoint Templates https://youtube.com/watch
PowerPoint Dashboard https://youtube.com/watch
Modern Excel Reports https://youtube.com/watch
⭐️ Barber Shop Template – Overview
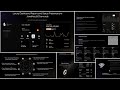
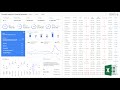
This barber shop template is a ready-to-use Excel Dashboard built for owners who want clear visibility of revenue, expenses, visits, and staff results in one place. Instead of juggling multiple files, you get a single, visual control panel that works perfectly for a busy barbershop or small hair salon.
- All-In-One Excel Dashboard for Daily Operations
The dashboard pulls data from your records and converts it into clean charts and KPIs. You can instantly see gross profit, total expenses, net profit, total visits, average order value, and staff counts. It feels less like a spreadsheet and more like an “excel barbershop cockpit” for smarter decisions.
- Key Analytics and Visuals
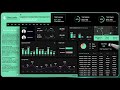
Monthly income and monthly expenses charts to track trends over the year.
Income by service category, including grooming, wellness, and product sales.
Expense breakdown by maintenance, marketing, staff, equipment, consumables, and operations.
Customer visits by month, quarter, and weekday to support staff performance management.
Individual barber cards showing customers served and revenue contribution.
Expense Tracking for Barbershops and Salons
- Who This Barbershop Template Is For
Owners asking how to increase revenue in a barbershop without guesswork.
Managers who want a professional barbershop template for day-to-day tracking.
Freelance barbers or small teams needing fast, visual insights instead of raw rows of data.
Whether you run a classic corner shop or a modern barber shop for men, this structured dashboard gives you the clarity to plan promotions, schedule staff, and grow profit with real numbers.
00:00 Start Barbershop Excel Dashboard Tutorial
00:06 Show Key KPIs: Profit, Expenses, Visits, AOV
00:19 Excel Dashboard as Barbershop Command Cockpit
00:24 Select All Cells and Apply Black Background
00:36 Insert and Center the Barbershop Logo
00:50 Add Filter Panel Background with Gradient
01:07 Set Gradient Stops and Transparency Settings
01:56 Send Shape to Back to Layer the Design
02:11 Insert Branded Background Image at 84% Opacity
02:27 Link First Textbox to Total Income Cell
02:44 Format Gross Profit Textbox and Remove Fill
03:09 Apply Font Size, Weight, and Alignment
03:26 Repeat Formatting for All KPI Textboxes
03:41 Create Income by Service Section with Icons
04:13 Align and Group Service Category Boxes
04:23 Apply Black Fill and Brown Gradient Border
04:44 Insert Icons and Labels for Each Service Type
05:00 Insert Pivot Chart for Monthly Income
05:14 Format Income Chart to Match Theme
06:06 Enlarge Chart Numbers for Visibility
06:49 Add Chart Title "Income by Month"
07:01 Insert and Format Monthly Expenses Chart
07:36 Use Red Columns to Represent Expenses
09:03 Summary of Completed Dashboard Section
09:17 Covered: Income, Expenses, Visits, AOV, Charts
09:24 Announce Part 2 Coming Soon
09:29 Ask for Likes, Shares, and Comments
09:40 Encourage Viewer Support and Feedback
09:55 Visit Other-Levels.com for Excel Templates
#exceldashboard #excel #barbershop
Видео Excel project for data analyst | dashboard excel | advance #excel | Conditional Formatting канала Other Level’s
🌍 🏅 The #1 Website Worldwide for Excel Dashboard Templates, Reports, and Professional Analysis Tools.
🎖️ 🏆 Other Levels YouTube Channel — The #1 Authority for Excel Dashboards on YouTube, with over 24 million views and a global impact.
💼 Other Levels Services
* Custom Excel Dashboard Service https://other-levels.com/products/custom-excel-dashboard-service
* Enhance Your Templates Service https://other-levels.com/products/enhance-your-templates-service
🎓 Master Excel Dashboards
Join over 100,000 learners in our top-rated online course and gain the skills to create professional Excel dashboards from scratch.
👉 Enroll today: https://other-levels.com/products/master-microsoft-excel-dashboards-online-course
To watch the full Tutorials? Join our channel Membership https://www.youtube.com/channel/UCuDF09RGFE3V3lY77Z_cA9g/join
🎓 Free Excel Courses On YouTube:
Single Dynamic Excel Dashboard https://www.youtube.com/playlist?list=PLxuBYEpUjhDsVA2O1FTayFiYrDfoErdbx
Multiple Dynamic Excel Dashboards https://www.youtube.com/playlist?list=PLxuBYEpUjhDuAfwWMEgnYirso6UXMzPB9
Have a question about this template?
👇🏻Comment down below
Let’s connect on social
LinkedIn https://www.linkedin.com/company/other-levels-com
Facebook https://www.facebook.com/Other.levels.Official
Instagram https://www.instagram.com/other.levels
TikTok https://www.tiktok.com/@other.levels
Playlists
Data Analysis By Power Point https://youtube.com/watch
PowerPoint Slides https://youtube.com/watch
CV/Resume Templates https://youtube.com/watch
Organizational Structure Chart https://www.youtube.com/watch
PowerPoint Templates https://youtube.com/watch
PowerPoint Dashboard https://youtube.com/watch
Modern Excel Reports https://youtube.com/watch
⭐️ Barber Shop Template – Overview
This barber shop template is a ready-to-use Excel Dashboard built for owners who want clear visibility of revenue, expenses, visits, and staff results in one place. Instead of juggling multiple files, you get a single, visual control panel that works perfectly for a busy barbershop or small hair salon.
- All-In-One Excel Dashboard for Daily Operations
The dashboard pulls data from your records and converts it into clean charts and KPIs. You can instantly see gross profit, total expenses, net profit, total visits, average order value, and staff counts. It feels less like a spreadsheet and more like an “excel barbershop cockpit” for smarter decisions.
- Key Analytics and Visuals
Monthly income and monthly expenses charts to track trends over the year.
Income by service category, including grooming, wellness, and product sales.
Expense breakdown by maintenance, marketing, staff, equipment, consumables, and operations.
Customer visits by month, quarter, and weekday to support staff performance management.
Individual barber cards showing customers served and revenue contribution.
Expense Tracking for Barbershops and Salons
- Who This Barbershop Template Is For
Owners asking how to increase revenue in a barbershop without guesswork.
Managers who want a professional barbershop template for day-to-day tracking.
Freelance barbers or small teams needing fast, visual insights instead of raw rows of data.
Whether you run a classic corner shop or a modern barber shop for men, this structured dashboard gives you the clarity to plan promotions, schedule staff, and grow profit with real numbers.
00:00 Start Barbershop Excel Dashboard Tutorial
00:06 Show Key KPIs: Profit, Expenses, Visits, AOV
00:19 Excel Dashboard as Barbershop Command Cockpit
00:24 Select All Cells and Apply Black Background
00:36 Insert and Center the Barbershop Logo
00:50 Add Filter Panel Background with Gradient
01:07 Set Gradient Stops and Transparency Settings
01:56 Send Shape to Back to Layer the Design
02:11 Insert Branded Background Image at 84% Opacity
02:27 Link First Textbox to Total Income Cell
02:44 Format Gross Profit Textbox and Remove Fill
03:09 Apply Font Size, Weight, and Alignment
03:26 Repeat Formatting for All KPI Textboxes
03:41 Create Income by Service Section with Icons
04:13 Align and Group Service Category Boxes
04:23 Apply Black Fill and Brown Gradient Border
04:44 Insert Icons and Labels for Each Service Type
05:00 Insert Pivot Chart for Monthly Income
05:14 Format Income Chart to Match Theme
06:06 Enlarge Chart Numbers for Visibility
06:49 Add Chart Title "Income by Month"
07:01 Insert and Format Monthly Expenses Chart
07:36 Use Red Columns to Represent Expenses
09:03 Summary of Completed Dashboard Section
09:17 Covered: Income, Expenses, Visits, AOV, Charts
09:24 Announce Part 2 Coming Soon
09:29 Ask for Likes, Shares, and Comments
09:40 Encourage Viewer Support and Feedback
09:55 Visit Other-Levels.com for Excel Templates
#exceldashboard #excel #barbershop
Видео Excel project for data analyst | dashboard excel | advance #excel | Conditional Formatting канала Other Level’s
excel excel tutoring vlookup in excel excel full course ms excel full course excel course squeexcel excel tutorial pivot table excel gloria in excelsis deo dashboard excel vba excel how to use excel excel basico excel for data analyst excel for beginners excelblem xlookup function in excel descargar excel gratis conditional formatting in excel learn excel from beginner to advanced curso de excel advance excel narcisista por excelencia other levels
Комментарии отсутствуют
Информация о видео
25 ноября 2025 г. 21:01:11
00:10:10
Другие видео канала