- Популярные видео
- Авто
- Видео-блоги
- ДТП, аварии
- Для маленьких
- Еда, напитки
- Животные
- Закон и право
- Знаменитости
- Игры
- Искусство
- Комедии
- Красота, мода
- Кулинария, рецепты
- Люди
- Мото
- Музыка
- Мультфильмы
- Наука, технологии
- Новости
- Образование
- Политика
- Праздники
- Приколы
- Природа
- Происшествия
- Путешествия
- Развлечения
- Ржач
- Семья
- Сериалы
- Спорт
- Стиль жизни
- ТВ передачи
- Танцы
- Технологии
- Товары
- Ужасы
- Фильмы
- Шоу-бизнес
- Юмор
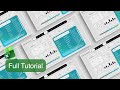
Sales Performance Dashboard in Excel | Track KPIs, Trends & Growth Metrics
https://www.other-levels.com
🌍 🏅 The #1 Website Worldwide for Excel Dashboard Templates, Reports, and Professional Analysis Tools.
🎖️ 🏆 Other Levels YouTube Channel — The #1 Authority for Excel Dashboards on YouTube, with over 24 million views and a global impact.
💼 Other Levels Services
* Custom Excel Dashboard Service https://other-levels.com/products/custom-excel-dashboard-service
* Enhance Your Templates Service https://other-levels.com/products/enhance-your-templates-service
🎓 Master Excel Dashboards
Join over 100,000 learners in our top-rated online course and gain the skills to create professional Excel dashboards from scratch.
👉 Enroll today: https://other-levels.com/products/master-microsoft-excel-dashboards-online-course
To watch the full Tutorials? Join our channel Membership https://www.youtube.com/channel/UCuDF09RGFE3V3lY77Z_cA9g/join
🎓 Free Excel Courses On YouTube:
Single Dynamic Excel Dashboard https://www.youtube.com/playlist?list=PLxuBYEpUjhDsVA2O1FTayFiYrDfoErdbx
Multiple Dynamic Excel Dashboards https://www.youtube.com/playlist?list=PLxuBYEpUjhDuAfwWMEgnYirso6UXMzPB9
Have a question about this template?
👇🏻Comment down below
Let’s connect on social
LinkedIn https://www.linkedin.com/company/other-levels-com
Facebook https://www.facebook.com/Other.levels.Official
Instagram https://www.instagram.com/other.levels
TikTok https://www.tiktok.com/@other.levels
Playlists
Data Analysis By Power Point https://youtube.com/watch
PowerPoint Slides https://youtube.com/watch
CV/Resume Templates https://youtube.com/watch
Organizational Structure Chart https://www.youtube.com/watch
PowerPoint Templates https://youtube.com/watch
PowerPoint Dashboard https://youtube.com/watch
Modern Excel Reports https://youtube.com/watch
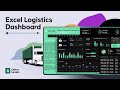
⭐️ Unlock the full power of your sales data with the Sales Performance Systems Dashboard—a fully interactive Excel template crafted by Other Levels. Designed for sales managers, business owners, and analysts, this dashboard offers a streamlined approach to tracking sales KPIs, monitoring growth, and making data-driven decisions with ease.
What You’ll Learn or See in This Video:
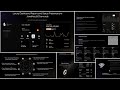
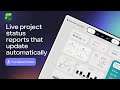
* Real-time sales tracking and performance visualization
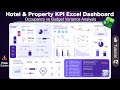
* Key sales KPIs like revenue, growth rate, and performance ratios
* Use of PivotTables for advanced analysis
* Interactive slicers and filters for deeper insights
* How to generate custom reports tailored to your needs
* Professional layout ideal for board meetings or client reports
Whether you're reviewing monthly results or analyzing yearly performance, this Excel Dashboard will help you optimize sales efficiency and identify new opportunities for business growth.
No advanced Excel skills needed — pre-built automation and formulas included.
Stay tuned for future tutorials on Excel dashboard building, KPI analysis, and business templates.
00:00 Excel Dashboard Overview
00:51 Get Templates at other-levels.com
01:00 Start Creating Excel Dashboard Step by Step
#SalesDashboardExcel #SalesKPITracker #ExcelDashboardTemplate #SalesPerformanceDashboard #ExcelForBusiness #OtherLevels #SalesReportingTool #DashboardDesign #ExcelKPI #BusinessAnalytics
Видео Sales Performance Dashboard in Excel | Track KPIs, Trends & Growth Metrics канала Other Level’s
🌍 🏅 The #1 Website Worldwide for Excel Dashboard Templates, Reports, and Professional Analysis Tools.
🎖️ 🏆 Other Levels YouTube Channel — The #1 Authority for Excel Dashboards on YouTube, with over 24 million views and a global impact.
💼 Other Levels Services
* Custom Excel Dashboard Service https://other-levels.com/products/custom-excel-dashboard-service
* Enhance Your Templates Service https://other-levels.com/products/enhance-your-templates-service
🎓 Master Excel Dashboards
Join over 100,000 learners in our top-rated online course and gain the skills to create professional Excel dashboards from scratch.
👉 Enroll today: https://other-levels.com/products/master-microsoft-excel-dashboards-online-course
To watch the full Tutorials? Join our channel Membership https://www.youtube.com/channel/UCuDF09RGFE3V3lY77Z_cA9g/join
🎓 Free Excel Courses On YouTube:
Single Dynamic Excel Dashboard https://www.youtube.com/playlist?list=PLxuBYEpUjhDsVA2O1FTayFiYrDfoErdbx
Multiple Dynamic Excel Dashboards https://www.youtube.com/playlist?list=PLxuBYEpUjhDuAfwWMEgnYirso6UXMzPB9
Have a question about this template?
👇🏻Comment down below
Let’s connect on social
LinkedIn https://www.linkedin.com/company/other-levels-com
Facebook https://www.facebook.com/Other.levels.Official
Instagram https://www.instagram.com/other.levels
TikTok https://www.tiktok.com/@other.levels
Playlists
Data Analysis By Power Point https://youtube.com/watch
PowerPoint Slides https://youtube.com/watch
CV/Resume Templates https://youtube.com/watch
Organizational Structure Chart https://www.youtube.com/watch
PowerPoint Templates https://youtube.com/watch
PowerPoint Dashboard https://youtube.com/watch
Modern Excel Reports https://youtube.com/watch
⭐️ Unlock the full power of your sales data with the Sales Performance Systems Dashboard—a fully interactive Excel template crafted by Other Levels. Designed for sales managers, business owners, and analysts, this dashboard offers a streamlined approach to tracking sales KPIs, monitoring growth, and making data-driven decisions with ease.
What You’ll Learn or See in This Video:
* Real-time sales tracking and performance visualization
* Key sales KPIs like revenue, growth rate, and performance ratios
* Use of PivotTables for advanced analysis
* Interactive slicers and filters for deeper insights
* How to generate custom reports tailored to your needs
* Professional layout ideal for board meetings or client reports
Whether you're reviewing monthly results or analyzing yearly performance, this Excel Dashboard will help you optimize sales efficiency and identify new opportunities for business growth.
No advanced Excel skills needed — pre-built automation and formulas included.
Stay tuned for future tutorials on Excel dashboard building, KPI analysis, and business templates.
00:00 Excel Dashboard Overview
00:51 Get Templates at other-levels.com
01:00 Start Creating Excel Dashboard Step by Step
#SalesDashboardExcel #SalesKPITracker #ExcelDashboardTemplate #SalesPerformanceDashboard #ExcelForBusiness #OtherLevels #SalesReportingTool #DashboardDesign #ExcelKPI #BusinessAnalytics
Видео Sales Performance Dashboard in Excel | Track KPIs, Trends & Growth Metrics канала Other Level’s
dashboard dashboard design dashboard updates data analysis data insights data visualization dynamic excel excel dashboard excel dashboard template excel formulas excel functions kpi metrics kpi tracking monthly analytics monthly reporting monthly sales tracker other levels other-levels.com performance dashboard sales analytics sales dashboard excel sales forecast sales kpi excel sales optimization sales performance tracker sales scorecard template
Комментарии отсутствуют
Информация о видео
23 февраля 2021 г. 1:35:31
00:21:58
Другие видео канала