Beautiful Power BI Dashboard with Northwind Database
#PowerBI #BIDashoards
Hello Friends,
In this video, you will learn how to create a beautiful Power BI dashboard using Northwind database using Odata Feed. To create the background images for Power BI dashboard, we have used Microsoft Power Point. We have created page navigation bar in the left side.
Northwind Database URL:
https://services.odata.org/Northwind/Northwind.svc/
Wallpaper image has been taken form https://pixabay.com/
Please download the practice file from below given link:
https://www.pk-anexcelexpert.com/beautiful-power-bi-dashboard-with-northwind-database/
Download our free Excel utility Tool and improve your productivity:
https://www.pk-anexcelexpert.com/products/pks-utility-tool-v1-0/
See our Excel Products:
https://www.pk-anexcelexpert.com/products/
Visit to learn more:
Chart and Visualizations: https://www.pk-anexcelexpert.com/category/blogs/charts-and-visualization/
VBA Course: https://www.pk-anexcelexpert.com/vba/
Download useful Templates: https://www.pk-anexcelexpert.com/category/templates/
Dashboards: https://www.pk-anexcelexpert.com/excel-dashboard/
Watch the best info-graphics and dynamic charts from below link:
https://www.youtube.com/playlist?list=PLbDvAYjpWJ7CEAHn-iuGSeLbUtFnYekHr
Learn and free download best excel Dashboard template:
https://www.youtube.com/playlist?list=PLbDvAYjpWJ7CpupRYMRkXSN0L92t7nUuF
Learn Step by Step VBA:
https://www.youtube.com/playlist?list=PLbDvAYjpWJ7BcoaFQD-syOrZzNSLZycwH
Website:
https://WWW.PK-AnExcelExpert.com
Facebook:
https://www.facebook.com/PKAnExcelExpert
Telegram:
https://t.me/joinchat/AAAAAE2OnviiEk5o1o8i4w
Pinterest:
https://www.pinterest.com/PKAnExcelExpert/
************* Suggested Books *********
VBA: https://amzn.to/2TMMikX
Excel Dashboard: https://amzn.to/2WZi2Fj
Power Query: https://amzn.to/2Ibd7xR
Power Pivot and Power BI: https://amzn.to/2DCg8BB
Exam Ref 70-778 (Power BI): https://amzn.to/2GnWYTN
************* My Stuff ****************
Mic : https://amzn.to/2TLnF88
Video Editor: https://screencast-o-matic.com/refer/cFe0Q6jzoA
Видео Beautiful Power BI Dashboard with Northwind Database канала PK: An Excel Expert
Показать
Комментарии отсутствуют
Информация о видео
Другие видео канала
 How to Build a PowerBI Interactive Dashboard from Scratch in Just 40 Minutes
 Static and Dynamic Row Level Security in Power BI
 Comparative Analysis Dashboard in Power BI | Step by Step Design, Data Model, DAX and Publish
 Learn with the Nerds: Beginning DAX Concepts with Power BI
 Fully Automated Excel dashboard with multiple source files | No VBA used
 Use the Power BI Decomposition Tree to Explore and Analyze Your Data
 Amazing Power BI Reports for Inspiration - April 2021 Contest Winners
 Pivot Table with Progress Chart and Dashboard
 How to Design Visually Stunning Power BI Reports
 How to use Microsoft Power BI - Tutorial for Beginners
 Top 10 Most Effective Power BI Dashboard Tips & Tricks In 2020
 How to build Interactive Excel Dashboards
 Power BI Full Course - Learn Power BI in 4 Hours | Power BI Tutorial for Beginners | Edureka
![Power BI Beginner to Pro [Full Course]](https://i.ytimg.com/vi/5X5LWcLtkzg/default.jpg) Power BI Beginner to Pro [Full Course]
Power BI Beginner to Pro [Full Course] Power BI Tutorial From Beginner to Pro ⚡ Desktop to Dashboard in 60 Minutes ⏰
 Power BI Dashboard Tutorial: Year over Year Difference Analysis
 Quality Analysis Dashboard in Power BI| Design, Data Model, DAX and Publish Complete tutorial
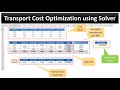 Transport Cost Optimization Using Solver in Excel
 Is MANY TO MANY, too many? | Power BI many to many relationships explained
 Annual Leave Tracker with Daily/Monthly View in Excel