Thinkorswim Scan Relative Strength
Quickly find stocks that over-perform or under-perform an index. This video shows how to configure a custom scan in Thinkorswim using an improved Relative Strength study. Use recent market turning points as your start date. The scan will compare stock performance from that date forward. Easily find stocks that are trending stronger or weaker than the index. Catch stocks as they make their first transition from under-perform to over-perform. Find out where the big money is reallocating their holdings. Markets go through cycles, and during transitions the old leaders are replaced by new ones. This scan will help you spot those stocks which are in the process of that transition. Free custom code is included. The clickable link is embedded directly in the video. Be sure to not to miss it.
Link to study file - Scan_RelativeStrengthSTUDY.ts: https://www.hahn-tech.com/download1scan2relative3strength/
DISCLAIMER: I AM NOT A CERTIFIED FINANCIAL ADVISOR AND NOTHING IN THIS VIDEO OR TEXT IS AN ADVERTISEMENT OR RECOMMENDATION TO BUY OR SELL ANY FINANCIAL INSTRUMENT. NOR IS THIS VIDEO OR TEXT INTENDED TO INSTRUCT YOU ON HOW TO MAKE BUY OR SELL DECISIONS USING ANY OF THESE INDICATORS.
*Thinkorswim is a chart analysis platform offered by TD Ameritrade: www.tdameritrade.com
TD Ameritrade provides financial services including the trading of Stocks, Futures, Options and Forex.
Please be sure to share this page with your friends and colleagues. Leaving comments below is the best way to help make the content of this site even better.
Here is the code used to create your own custom watchlist columns as demonstrated in the video below.
Видео Thinkorswim Scan Relative Strength канала Hahn-Tech, LLC
Показать
Комментарии отсутствуют
Информация о видео
Другие видео канала
 Best ThinkorSwim Indicators || Relative Strength/Weakness
 A Smarter Long Call Options Strategy | How to Buy Calls on thinkorswim®
 Scripts & Scans To Find Stocks Above Moving Averages With Relative Strength | Technically Speaking
 MACD Indicator Secrets: 3 Powerful Strategies to Profit in Bull & Bear Markets
 How to Scan for Relative Strength Intraday
 Thinkorswim Pre-Market Gap Scan | How to Scan and Find Stock PreMarket (2019)
 The Most Powerful Forex Trading Indicator by Adam Khoo
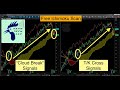 Thinkorswim Scan Ichimoku
 Learn how to Day Trade Gappers and Gaps (Beginner Momentum Trading Strategies)
 Unlock the Power of thinkorswim Scanning
 The Relative Strength Line Indicator | Two Minute Trading Tutorial
 Thinkorswim Scan Volume Profile
 Use the TTM Squeeze Scan Setup in Thinkorswim
 Thinkorswim Scans Beginner to Advanced
 Thinkorswim Chart Settings Part Two
 Thinkorswim Automated Round Trip Trades
 Q&A: IBD Relative Strength Rating vs. Relative Strength Line
 Thinkorswim Chart Settings Part One
 Pre Market Scanner Made Simple Think or Swim
 Best Day Trading Indicator || Buy vs. Sell