The Relative Strength Line Indicator | Two Minute Trading Tutorial
TraderLion Scripts: https://www.traderlion.com/tl-scripts/
TL Enhanced Volume Video: https://youtu.be/K0VFS-I83_g
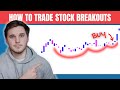
The Relative Strength Line Indicator shows how a stock is performing versus the rest of the market. It is calculated by finding the ratio between the stocks price and the price of the SPX. As a stock moves up the right side of a base we want the RS line to be in a strong uptrend and on the breakout it should be leading or matching price.
In this video Richard discusses how to use the RS Line and the Green Dot and Pink Dot indicators which identify when it is making a new high and the relative strength new high before price (RSNHBP) characteristic,
Enjoy!
- The TL Team
-----------------------------------------------------------------------------------------------------------------------
Learn how to find the next TSLA AMZN and AAPL with our Leadership Blueprints Course: https://www.traderlion.com/leadership-blueprints/
-----------------------------------------------------------------------------------------------------------------------
Stay in touch:
Follow us on Twitter: https://www.twitter.com/TraderLion_
Like us on Facebook: https://www.facebook.com/TraderLion
Our Blog: https://www.traderlion.com/blog/
Видео The Relative Strength Line Indicator | Two Minute Trading Tutorial канала TraderLion
TL Enhanced Volume Video: https://youtu.be/K0VFS-I83_g
The Relative Strength Line Indicator shows how a stock is performing versus the rest of the market. It is calculated by finding the ratio between the stocks price and the price of the SPX. As a stock moves up the right side of a base we want the RS line to be in a strong uptrend and on the breakout it should be leading or matching price.
In this video Richard discusses how to use the RS Line and the Green Dot and Pink Dot indicators which identify when it is making a new high and the relative strength new high before price (RSNHBP) characteristic,
Enjoy!
- The TL Team
-----------------------------------------------------------------------------------------------------------------------
Learn how to find the next TSLA AMZN and AAPL with our Leadership Blueprints Course: https://www.traderlion.com/leadership-blueprints/
-----------------------------------------------------------------------------------------------------------------------
Stay in touch:
Follow us on Twitter: https://www.twitter.com/TraderLion_
Like us on Facebook: https://www.facebook.com/TraderLion
Our Blog: https://www.traderlion.com/blog/
Видео The Relative Strength Line Indicator | Two Minute Trading Tutorial канала TraderLion
Показать
Комментарии отсутствуют
Информация о видео
Другие видео канала
 How to Buy Stock Breakouts | The Volatility Contraction Pattern (VCP)
 How To Find Stocks With High Relative Strength
 Trading Strategies: Using Pocket Pivots to Identify Institutional Accumulation
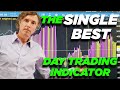 The SINGLE BEST Indicator for Day Trading (NOT MACD, CCI, RSI or anything else you've ever heard of)
 Crash Course: How To Master Buying Pullbacks | Portfolio Manager Charles Harris
 The Ultimate Guide to Relative Strength | Joe Fahmy
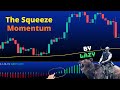 Most Popular Indicator Ever: Squeeze Momentum Indicator (by Lazybear) - Catching Breakouts Tutorial
 How to Use the Relative Strength Index (RSI)
 The MACD Indicator must be the BEST Beginner Trading Indicator | Trading Indicators
 Free Relative Strength Scan
 What is a Pivot Point? | The Optimal Buy Point for Breakout Stock Trading
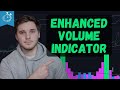 Enhanced Volume Trading Indicator | Two Minute Tuesday Tutorial
 How to use the Relative Strength Line (RS Line) for stocks
 How to Setup Multiple Charts on ThinkorSwim
 How to Time The Stock Market and Determine the Trend | 50 Year Trading Veteran Dr. Eric Wish.
 Trading Up-Close: Relative Strength Index
 Why The Relative Strength Line Is My Favorite Technical Indicator | Alissa Coram
 TradingView Tutorial for Beginners
 BEST Trading Strategy 2021? - US Champion Trader Oliver Kell discloses his winning strategy.