Maximize Your Chart Space With This Simple Trick
Learn how to plot lower panel indicators to the upper panel charts in ThinkOrSwim. We'll use the RSI as an example, and I'll show you how to plot the indicator on your price charts.
Here are all the links mentioned in the video:
➜ Futures Volatility Box:
https://tosindicators.com/volatility-box/futures
➜ Stock Volatility Box:
https://tosindicators.com/volatility-box/stocks
-----------------------------------------------------------
⏱️ Here are video timestamps that might come in handy:
0:08 - Introduction
0:42 - RSI Code Walkthrough
5:02 - Writing Custom Code
8:28 - Custom RSI Settings
13:20 - Summary
-----------------------------------------------------------
✅ Download the Futures Volatility Box here:
https://www.tosindicators.com/volatility-box
✅ Download the Stock Volatility Box here:
https://www.volatilitybox.com/product/volatility-box-stock-early-invite/
✅ Watch the new Triple Pro Squeeze course here:
https://www.tosindicators.com/squeeze-course
#trading #ThinkOrSwim #RSI
Видео Maximize Your Chart Space With This Simple Trick канала TOS Indicators
Показать
Комментарии отсутствуют
Информация о видео
Другие видео канала
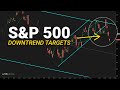 SPY Resumes Down Trend - New Resistance Zones and Targets
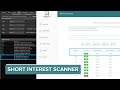 Short Interest Squeeze in Zillow (Z)
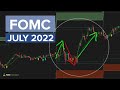 FOMC Volatility - S&P 500 (July 2022)
 Build a SPY Meltdown Backtester in 8 Minutes (Beginner-Friendly)
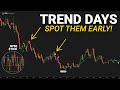 Spot Trend Days Early in the Morning (Market Internal Clues)
 Build a Santa Claus Rally Backtester in 11 Minutes (Beginner-Friendly)
 FTCH, DIS, AMAT and CSCO Earnings Plays
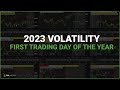 Volatility Breakdown - First Trading Day of 2023 (Reviewing 10 Major Markets)
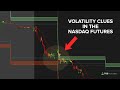 Why the Nasdaq was a "Leading" Volatility Indicator This Morning
 Our Stock Trading Game Plan - How We Approach Day Trading Stocks
 Build a Super Bowl Indicator for ThinkOrSwim in 25 Minutes
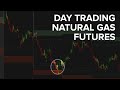 Natural Gas Futures - Day Trading Increased Volatility
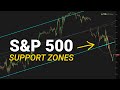 SPY Shorter Term Price Channel Broken - New Support Zones?
 3 Trade Ideas for High Volatility Days
 How to Use Intraday Volatility for Swing Trades
 SPY Bullish Reversal Trade Results (100%+ Winner)
 Day Trade Volatility With These 3 Setups
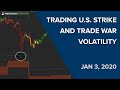 Trading U.S. Strike and Trade War Volatility - Jan. 3, 2020 - Volatility Box Report
 NEW Opening Range Breakout Platform - Launch Discount!
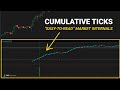 Download Cumulative TICK for 2023 (Updated) - Market Internals Simplified!
 Why the $76.50 Level is Key for Crude Oil