Why the $76.50 Level is Key for Crude Oil
In this video, we'll walk through the monthly, weekly and daily time frame charts of Crude Oil futures (/CL), to find trade opportunities. Oil futures are tagging the $76.50 level, which has historically been a significant level, going back to 2007 - 2008.
Here are all the links mentioned in today's video:
➜ Stock Volatility Box:
https://www.tosindicators.com/volatility-box/stocks
➜ Futures Volatility Box:
https://www.tosindicators.com/volatility-box/futures
-----------------------------------------------------------
⏱️ Here are video timestamps that might come in handy:
0:08 - Crude Oil Introduction
0:24 - Monthly Charts
0:45 - Weekly Charts
1:15 - Crude Oil $76.50 Level
2:45 - Daily Charts
3:05 - Trade Ideas
4:17 - Recap
-----------------------------------------------------------
Download the Stock Volatility Box here:
https://www.volatilitybox.com/product/volatility-box-stock-early-invite/
Download the Futures Volatility Box here:
https://www.tosindicators.com/volatility-box
Watch the new Triple Pro Squeeze course here:
https://www.tosindicators.com/squeeze-course
#Options #DayTrading #ThinkOrSwim
Видео Why the $76.50 Level is Key for Crude Oil канала TOS Indicators
Показать
Комментарии отсутствуют
Информация о видео
Другие видео канала
 SPY Resumes Down Trend - New Resistance Zones and Targets
 Short Interest Squeeze in Zillow (Z)
 FOMC Volatility - S&P 500 (July 2022)
 Build a SPY Meltdown Backtester in 8 Minutes (Beginner-Friendly)
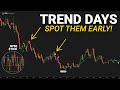 Spot Trend Days Early in the Morning (Market Internal Clues)
 Build a Santa Claus Rally Backtester in 11 Minutes (Beginner-Friendly)
 FTCH, DIS, AMAT and CSCO Earnings Plays
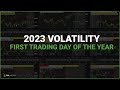 Volatility Breakdown - First Trading Day of 2023 (Reviewing 10 Major Markets)
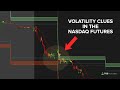 Why the Nasdaq was a "Leading" Volatility Indicator This Morning
 Our Stock Trading Game Plan - How We Approach Day Trading Stocks
 Build a Super Bowl Indicator for ThinkOrSwim in 25 Minutes
 Natural Gas Futures - Day Trading Increased Volatility
 SPY Shorter Term Price Channel Broken - New Support Zones?
 3 Trade Ideas for High Volatility Days
 How to Use Intraday Volatility for Swing Trades
 SPY Bullish Reversal Trade Results (100%+ Winner)
 Day Trade Volatility With These 3 Setups
 2 Volatility Setups to Trade Futures
 NEW Opening Range Breakout Platform - Launch Discount!
 Utility Labels Indicator Updated - Free ThinkOrSwim Download
 Download Cumulative TICK for 2023 (Updated) - Market Internals Simplified!