- Популярные видео
- Авто
- Видео-блоги
- ДТП, аварии
- Для маленьких
- Еда, напитки
- Животные
- Закон и право
- Знаменитости
- Игры
- Искусство
- Комедии
- Красота, мода
- Кулинария, рецепты
- Люди
- Мото
- Музыка
- Мультфильмы
- Наука, технологии
- Новости
- Образование
- Политика
- Праздники
- Приколы
- Природа
- Происшествия
- Путешествия
- Развлечения
- Ржач
- Семья
- Сериалы
- Спорт
- Стиль жизни
- ТВ передачи
- Танцы
- Технологии
- Товары
- Ужасы
- Фильмы
- Шоу-бизнес
- Юмор
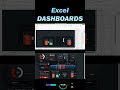
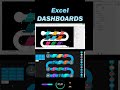
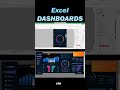
How to make an Excel dashboard for agile project management in app development
In this video, we show how to build an Excel dashboard for Agile project management with a real example of developing a personal finance application. The dashboard brings together key metrics that help teams track progress, manage costs, and improve efficiency throughout the project lifecycle.
Agile Project Management Excel Dashboard Template https://exceltable.com/en/templates/agile-project-management-excel-dashboard
You will see how a burndown chart keeps sprints on schedule, how monthly expenses connect to overall budget and cost, and how a sprint cycle visualization makes iteration planning easier. The dashboard also highlights HR team activity, scope of work, and tasks completed so you can clearly evaluate team performance.
To strengthen decision making, the report includes cost structure analysis, risks probability assessment, and a time remaining indicator that helps anticipate project outcomes. This combination of visuals makes the dashboard a complete tool for agile tracking in app development.
Video Chapters ▶️
0:00 Introduction
1:33 Creating the background
1:53 Designing the base shape with gradient and soft shadows
4:42 Building the dashboard grid
6:28 KPI cards with glass neon design
11:15 Creating 3D blocks for dashboard visualization elements
16:14 Setting up source data and pivot tables in Excel
17:28 Formula table for building an interactive Burndown Chart
20:13 Adding controls with pivot table slicer buttons
21:10 How to make a beautiful Burndown Chart in Excel for Agile project management
26:53 Fresh design for dashboard slicer buttons
30:36 Building a risk probability chart
33:25 Radar chart for analyzing budget cost structure by key categories
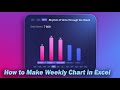
38:56 Bar chart with cursor to display monthly expenses
47:10 Budget utilization chart for planned project costs
53:37 Formulas for HR team activity histogram
56:04 How to make a themed Human Resources chart in Excel
58:57 Using PowerPoint editor for an impressive HR chart in Excel
1:06:51 How to create an interactive Agile sprint cycle in Excel
1:09:25 Main chart for Agile project management
1:24:15 Adding dynamic data labels to KPI cards
1:32:55 Testing Agile project management presentation in Excel
This video shows how to create an Excel dashboard for Agile project management in app development. You will see how to design the layout, set up data, build a Burndown Chart, analyze budget and risks, track HR activity, and present key metrics for effective project control.
By the end of the tutorial, you’ll understand how to create an interactive Excel dashboard that supports Agile project management and helps turn complex project data into actionable insights.
Видео How to make an Excel dashboard for agile project management in app development канала Excel Visual
Agile Project Management Excel Dashboard Template https://exceltable.com/en/templates/agile-project-management-excel-dashboard
You will see how a burndown chart keeps sprints on schedule, how monthly expenses connect to overall budget and cost, and how a sprint cycle visualization makes iteration planning easier. The dashboard also highlights HR team activity, scope of work, and tasks completed so you can clearly evaluate team performance.
To strengthen decision making, the report includes cost structure analysis, risks probability assessment, and a time remaining indicator that helps anticipate project outcomes. This combination of visuals makes the dashboard a complete tool for agile tracking in app development.
Video Chapters ▶️
0:00 Introduction
1:33 Creating the background
1:53 Designing the base shape with gradient and soft shadows
4:42 Building the dashboard grid
6:28 KPI cards with glass neon design
11:15 Creating 3D blocks for dashboard visualization elements
16:14 Setting up source data and pivot tables in Excel
17:28 Formula table for building an interactive Burndown Chart
20:13 Adding controls with pivot table slicer buttons
21:10 How to make a beautiful Burndown Chart in Excel for Agile project management
26:53 Fresh design for dashboard slicer buttons
30:36 Building a risk probability chart
33:25 Radar chart for analyzing budget cost structure by key categories
38:56 Bar chart with cursor to display monthly expenses
47:10 Budget utilization chart for planned project costs
53:37 Formulas for HR team activity histogram
56:04 How to make a themed Human Resources chart in Excel
58:57 Using PowerPoint editor for an impressive HR chart in Excel
1:06:51 How to create an interactive Agile sprint cycle in Excel
1:09:25 Main chart for Agile project management
1:24:15 Adding dynamic data labels to KPI cards
1:32:55 Testing Agile project management presentation in Excel
This video shows how to create an Excel dashboard for Agile project management in app development. You will see how to design the layout, set up data, build a Burndown Chart, analyze budget and risks, track HR activity, and present key metrics for effective project control.
By the end of the tutorial, you’ll understand how to create an interactive Excel dashboard that supports Agile project management and helps turn complex project data into actionable insights.
Видео How to make an Excel dashboard for agile project management in app development канала Excel Visual
excel visual Excel dashboard for Agile project management How to build a Burndown Chart in Excel Project management dashboard in Excel tutorial Agile project tracking Excel dashboard Excel visualization for app development projects Budget and cost analysis in Excel dashboard HR activity tracking in Excel dashboard Risk probability chart in Excel project management Interactive Excel dashboard for Agile reporting Personal finance app project management in Excel
Комментарии отсутствуют
Информация о видео
18 сентября 2025 г. 4:12:15
01:33:29
Другие видео канала