- Популярные видео
- Авто
- Видео-блоги
- ДТП, аварии
- Для маленьких
- Еда, напитки
- Животные
- Закон и право
- Знаменитости
- Игры
- Искусство
- Комедии
- Красота, мода
- Кулинария, рецепты
- Люди
- Мото
- Музыка
- Мультфильмы
- Наука, технологии
- Новости
- Образование
- Политика
- Праздники
- Приколы
- Природа
- Происшествия
- Путешествия
- Развлечения
- Ржач
- Семья
- Сериалы
- Спорт
- Стиль жизни
- ТВ передачи
- Танцы
- Технологии
- Товары
- Ужасы
- Фильмы
- Шоу-бизнес
- Юмор
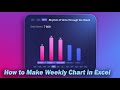
Excel Financial Dashboard for Measuring the Impact of Credit on Margin Performance
Learn how to use an Excel financial dashboard to measure the impact of credit on margin performance and profit.
Dashboard Template: https://exceltable.com/en/templates/dashboard-to-calculate-impact-of-credit-on-margin
✅ Borrowed capital can increase growth, but it also introduces risk. This interactive Excel dashboard clearly shows how debt load, markup, profit, and profitability are interconnected as credit volume changes.
In this video, you will see how to visualize the effects of borrowed funds in working capital using dynamic indicators and clear financial logic. The dashboard helps you understand how loan servicing costs affect margins, how markup influences profitability, and why risk management is one of the most important skills in business.
Effective cost control and sales control are the foundation of long-term financial stability, and this Excel tool makes that process transparent and measurable.
What you will learn in this video
✓ How to analyze credit impact on margin in Excel
✓ How to visualize profit and debt relationships
✓ How to control financial risk with dashboards
✓ How to monitor loan costs and business profitability
The template is designed for small business owners, analysts, and managers who need a practical tool for credit risk control and margin analysis.
Видео Excel Financial Dashboard for Measuring the Impact of Credit on Margin Performance канала Excel Visual
Комментарии отсутствуют
Информация о видео
1 декабря 2025 г. 22:39:13
00:03:00
Другие видео канала