- Популярные видео
- Авто
- Видео-блоги
- ДТП, аварии
- Для маленьких
- Еда, напитки
- Животные
- Закон и право
- Знаменитости
- Игры
- Искусство
- Комедии
- Красота, мода
- Кулинария, рецепты
- Люди
- Мото
- Музыка
- Мультфильмы
- Наука, технологии
- Новости
- Образование
- Политика
- Праздники
- Приколы
- Природа
- Происшествия
- Путешествия
- Развлечения
- Ржач
- Семья
- Сериалы
- Спорт
- Стиль жизни
- ТВ передачи
- Танцы
- Технологии
- Товары
- Ужасы
- Фильмы
- Шоу-бизнес
- Юмор
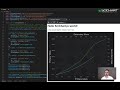
JavaScript Polar Chart Tutorial | Interactive Polar Area Charts with SciChart.js
Learn how to build high-performance polar area charts in JavaScript using SciChart.js — featuring gradient fills, smooth animations, interactive legends, and zoom and pan controls.
In this tutorial, you'll create an interactive polar chart using SciChartPolarSurface and WebGL-powered rendering. SciChart.js is designed for developers building analytics dashboards, engineering applications, scientific tools, and real-time data visualisation platforms that require scalable, high-performance charting.
What You’ll Learn:
✅ How to create a SciChartPolarSurface
✅ How to configure radial and angular axes
✅ How to structure datasets for polar charts
✅ How to render multiple polar area series
✅ How to apply gradient fills and WaveAnimation
✅ How to add zoom, pan, and interactive legends
Topics Covered:
- SciChartPolarSurface setup
- RadialAxis and AngularAxis configuration
- Polar chart data structure
- Multi-series polar rendering
- Gradient styling and animations
- Interactive legends and chart controls
Chapters:
00:00 Intro
00:20 Project overview
00:45 Create polar surface
01:35 Axes configuration
02:40 Data structure
03:20 Render polar series
04:35 Styling and animation
05:20 Interactivity
06:15 Final result
Get Started & Learn More:
Polar Chart Documentation: SciChart Polar Charts Docs
Live Demo: SciChart Polar Chart Demo
SciChart GPT: SciChart GPT
GitHub Examples: SciChart GitHub Examples
SciChart Blogs: SciChart Blog
#SciChart #JavaScriptCharts #PolarChart #DataVisualization #WebGL #JavaScript #RealTimeCharts #EngineeringApps #AnalyticsDashboard #ChartLibrary #FrontendDevelopment #SciChartJS
Видео JavaScript Polar Chart Tutorial | Interactive Polar Area Charts with SciChart.js канала SciChart: The fastest high precision charts
Комментарии отсутствуют
Информация о видео
30 апреля 2026 г. 16:55:25
00:03:46
Другие видео канала