- Популярные видео
- Авто
- Видео-блоги
- ДТП, аварии
- Для маленьких
- Еда, напитки
- Животные
- Закон и право
- Знаменитости
- Игры
- Искусство
- Комедии
- Красота, мода
- Кулинария, рецепты
- Люди
- Мото
- Музыка
- Мультфильмы
- Наука, технологии
- Новости
- Образование
- Политика
- Праздники
- Приколы
- Природа
- Происшествия
- Путешествия
- Развлечения
- Ржач
- Семья
- Сериалы
- Спорт
- Стиль жизни
- ТВ передачи
- Танцы
- Технологии
- Товары
- Ужасы
- Фильмы
- Шоу-бизнес
- Юмор
What's new in SciChart.js JavaScript Charts version 3.1
What's new in SciChart.js version 3.1? Read the full release note at https://www.scichart.com/scichart-js-v3-1-released/
1/ We’ve added “Just works” licencing support for sandbox sites such as CodePen, CodeSandbox and JSFiddle
In this version you can now create codepens, codesandboxes and js fiddles in SciChart.js without the need for a trial licence.
This allows you to try out new ideas quickly and share them with colleagues.
2/ We've added global exports for npm and an index.min.js
This simplifies the imports and unifies them for the vanilla JS and npm versions of the library.
3/ Massively improved documentation (work in progress)
SciChart.js has over 200 handwritten documentation pages as well as an auto generated TypeDoc API site.
We've updated over 60 of our documentation pages to have far greater detail and to embed codepens into the pages in the docs.
You'll now see new tabs for the JavaScript API as well as JSON builder API. Wherever you see the button “Edit on Codepen” you can click this to open the example in CodePen in a new tab, edit examples and try out new ideas.
4/ Contextual docs and codesandbox links for demos
We've updated all the demos in our site to include contextual documentation and code sandbox links
Head over to https://demo.scichart.com and open anyone of these examples.
The contextual documentation button takes you to the specific page relevant to that example in the docs. The codesandbox button opens up the example as a stand alone sample in a code sandbox. You can edit code, modify it, share it and more.
The code sandbox button toolbar has also been added to many of our embedded examples. Wherever you see this icon on the chart, hover it to see contextual documentation, links to npm, GitHub and codesandbox
5/ New Chart Title property
We've added a chart title property to the SciChartSurface. Until now many of our examples used annotations as a pseudo chart title. There is now a dedicated chart title property which may be displayed on the top, right, bottom or left of the chart, inside or outside the chart area and support multi line or single line text
6/ Custom ChartModifier2D/3D
We’ve added two new types: ChartModifier2D and 3D. These allow you to create behaviours which listen to mouse events and interact with the chart in new ways
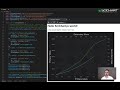
7/ Performance improvements
In SciChart JS 3.1 we've improved the performance of our charts. In this version of SciChart we've improved the big data performance by up to 100%. The real time performance of SciChart has also been improved by up to 30%.
SciChart.js offers world class performance for financial, medical and scientific applications.
8/ Multiple bugs/issues fixed
Finally multiple bugs and issues have been fixed in this version of size chart you can find a full list of what's new over at our website
Thank you for your time and attention to this video we hope you enjoy using SciChart.js v3.1
Видео What's new in SciChart.js JavaScript Charts version 3.1 канала SciChart: The fastest high precision charts
1/ We’ve added “Just works” licencing support for sandbox sites such as CodePen, CodeSandbox and JSFiddle
In this version you can now create codepens, codesandboxes and js fiddles in SciChart.js without the need for a trial licence.
This allows you to try out new ideas quickly and share them with colleagues.
2/ We've added global exports for npm and an index.min.js
This simplifies the imports and unifies them for the vanilla JS and npm versions of the library.
3/ Massively improved documentation (work in progress)
SciChart.js has over 200 handwritten documentation pages as well as an auto generated TypeDoc API site.
We've updated over 60 of our documentation pages to have far greater detail and to embed codepens into the pages in the docs.
You'll now see new tabs for the JavaScript API as well as JSON builder API. Wherever you see the button “Edit on Codepen” you can click this to open the example in CodePen in a new tab, edit examples and try out new ideas.
4/ Contextual docs and codesandbox links for demos
We've updated all the demos in our site to include contextual documentation and code sandbox links
Head over to https://demo.scichart.com and open anyone of these examples.
The contextual documentation button takes you to the specific page relevant to that example in the docs. The codesandbox button opens up the example as a stand alone sample in a code sandbox. You can edit code, modify it, share it and more.
The code sandbox button toolbar has also been added to many of our embedded examples. Wherever you see this icon on the chart, hover it to see contextual documentation, links to npm, GitHub and codesandbox
5/ New Chart Title property
We've added a chart title property to the SciChartSurface. Until now many of our examples used annotations as a pseudo chart title. There is now a dedicated chart title property which may be displayed on the top, right, bottom or left of the chart, inside or outside the chart area and support multi line or single line text
6/ Custom ChartModifier2D/3D
We’ve added two new types: ChartModifier2D and 3D. These allow you to create behaviours which listen to mouse events and interact with the chart in new ways
7/ Performance improvements
In SciChart JS 3.1 we've improved the performance of our charts. In this version of SciChart we've improved the big data performance by up to 100%. The real time performance of SciChart has also been improved by up to 30%.
SciChart.js offers world class performance for financial, medical and scientific applications.
8/ Multiple bugs/issues fixed
Finally multiple bugs and issues have been fixed in this version of size chart you can find a full list of what's new over at our website
Thank you for your time and attention to this video we hope you enjoy using SciChart.js v3.1
Видео What's new in SciChart.js JavaScript Charts version 3.1 канала SciChart: The fastest high precision charts
Комментарии отсутствуют
Информация о видео
27 апреля 2023 г. 22:03:41
00:03:51
Другие видео канала