- Популярные видео
- Авто
- Видео-блоги
- ДТП, аварии
- Для маленьких
- Еда, напитки
- Животные
- Закон и право
- Знаменитости
- Игры
- Искусство
- Комедии
- Красота, мода
- Кулинария, рецепты
- Люди
- Мото
- Музыка
- Мультфильмы
- Наука, технологии
- Новости
- Образование
- Политика
- Праздники
- Приколы
- Природа
- Происшествия
- Путешествия
- Развлечения
- Ржач
- Семья
- Сериалы
- Спорт
- Стиль жизни
- ТВ передачи
- Танцы
- Технологии
- Товары
- Ужасы
- Фильмы
- Шоу-бизнес
- Юмор
🔥 Fitness Dashboard in PowerBI | From Start to Finish Tutorial |
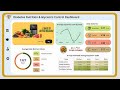
🚀 Fitness Dashboard in PowerBI
Unlock powerful insights from the fitness dataset with this comprehensive guide. Learn how to build an impactful and interactive Power BI dashboard from start to finish.
⚡ Here what’s covered:
📌 KPI,s Overview: Total Users, different workout type like Yoga, Strength, Cardio, HIIT Users, Average calories burned per hour, Average weekly workouts. These KPI’s help to understand user preferences and demand for different training, it’s evaluate the intensity and energy expenditure of each workout type and also tracks the users consistency and overall engament in each workout.
📌 Average BMI, Fat percentage, and Calories burned by workout type scatter chart: Helps us visualize the relationship between user body composition and workout effectiveness across different workout type.
📌 Fat percentage of workout type Donut chart: Shows the average body fat percentage of users participating in each type of workout.
📌 Average MAX, Active & Resting BPM by workout type clustered column chart: Compares heart rate metrics of MAX, Active & Resting BPM across different workout type.
📌 Average water intake by Age Group clustered bar chart: Shows the average daily water intake across different age groups helping us understand hydration habits among users of various ages.
📌 Slicer allows us to filter the dashboard data based on user’s fitness experience.
💬 Download Dataset and Background Image : https://github.com/shruthi2023/Fitness_Dashbard_in_PowerBI/tree/main
📝 CHECK THIS OUT! :
https://youtu.be/TdC9V8ZD7xc
https://www.youtube.com/watch?v=0YE7aW4qGP4
https://www.youtube.com/watch?v=H_Tu36fh5-Y&t=1s
🎵 Background music: “Saddle Up & Dance” from YouTube Audio Library
💳 Subscribe for more PowerBI tutorials and Analytics insights.
💙 Come along: www.youtube.com/@Shruthi_Mahadev
👍 Like & share if you found this useful!
#fitnessdashboardinpowerbi, #fitnesstrackerdashboard, #fitnessdashboard, #workoutdashboard, #gymdashboard, #healthylifestyledashboard,
Видео 🔥 Fitness Dashboard in PowerBI | From Start to Finish Tutorial | канала Shruthi Mahadev
Powerbidashboard dashboarddesign powerbi powerbiproject datavisualization powerbitutorial dataanalysis dataanalyst powerbipro powerbideveloper Dashboarddesign bireportdesign powerbidesktop dataviz powerbitips datainsights datastorytelling businessintelligence DAX datascience analysis powerbianalysis
Комментарии отсутствуют
Информация о видео
26 мая 2025 г. 13:07:00
01:07:48
Другие видео канала