- Популярные видео
- Авто
- Видео-блоги
- ДТП, аварии
- Для маленьких
- Еда, напитки
- Животные
- Закон и право
- Знаменитости
- Игры
- Искусство
- Комедии
- Красота, мода
- Кулинария, рецепты
- Люди
- Мото
- Музыка
- Мультфильмы
- Наука, технологии
- Новости
- Образование
- Политика
- Праздники
- Приколы
- Природа
- Происшествия
- Путешествия
- Развлечения
- Ржач
- Семья
- Сериалы
- Спорт
- Стиль жизни
- ТВ передачи
- Танцы
- Технологии
- Товары
- Ужасы
- Фильмы
- Шоу-бизнес
- Юмор
PowerBI Dashboard From Start to End || Advanced DAX || Coffee Trend and Spend Analysis Dashboard||
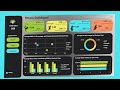
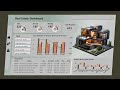
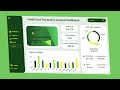
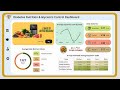
☕ Coffee Trend and Spend Analysis Dashboard
Learn Start to End built the Coffee Trend and Spend Analysis Dashboard in Power BI.
This dashboard provides a detailed view of customer spending habits, coffee sales patterns, and time-based performance insights.
You’ll walkthrough Advance key metrics such as total spend, peak hour spend, cups sold, peak hour cups sold, peak hours, and weekday vs weekend spend. Spending trends all visualized with interactive charts and slicers for deeper analysis.
📊 Core Analysis Points:
📌 Caffeine Spending trends
📌 Spend distribution by weekday and time of day
📌 Peak hour insights (cups & spend)
📌 Comparison between weekday and weekend sales
📌 Interactive Button slicers by coffee type
Perfect for learners and professionals looking to enhance their Power BI dashboarding and storytelling skills.
📝 Disclaimer :
Content on this channel is intended purely for educational and informational purposes. Statements made in this content reflect only the creators’ viewpoints and not those of any related organizations or individuals.
🔎 Download Dataset & Background Image: https://github.com/shruthi2023/Coffee_Shop_Dashboard
📈 Dashboard Tools:
📌 Built using Power BI
📌 Background created in Canva
🔎 CHECK THIS OUT! :
◽ https://youtu.be/6BZgVXbhlVM
◽ https://youtu.be/ljnhxdd03eQ
◽ https://youtu.be/KrAjBrcHZOg
🔔 Subscribe for more Data Analytics tutorials and insights.
💙 Come along: www.youtube.com/@Shruthi_Mahadev
#CoffeeTrendandSpendAnalysisDashboardinPowerBI, #CoffeeShopDashboard, #AdavancedDAX, #keyperformanceindicators, #CoffeeShopInsights, #coffeeSalesDashboard, #CoffeeShopAnalysis, #CoffeeTrendAnalysis, #PowerBICoffeeDashboard, #CaffeineDashboard, #CoffeeDataVisualization, #CoffeeShopBusinessAnalysis, #CaffeineConsumptionAnalysis, #PowerBIPracticeProject
Видео PowerBI Dashboard From Start to End || Advanced DAX || Coffee Trend and Spend Analysis Dashboard|| канала Shruthi Mahadev
Powerbidashboard dashboarddesign powerbi powerbiproject datavisualization powerbitutorial dataanalysis dataanalyst powerbipro powerbideveloper Dashboarddesign bireportdesign powerbidesktop dataviz powerbitips datainsights datastorytelling businessintelligence DAX datascience analysis powerbianalysis PowerBIForBeginners PowerBIReports PowerBITips PowerBIDesigner KPIAnalysis BusinessDashboard PowerBICharts PowerBIData PowerBIVisuals PowerBICreators PowerBISlicer DataReporting PowerBITraning
Комментарии отсутствуют
Информация о видео
16 октября 2025 г. 11:25:46
01:01:54
Другие видео канала