- Популярные видео
- Авто
- Видео-блоги
- ДТП, аварии
- Для маленьких
- Еда, напитки
- Животные
- Закон и право
- Знаменитости
- Игры
- Искусство
- Комедии
- Красота, мода
- Кулинария, рецепты
- Люди
- Мото
- Музыка
- Мультфильмы
- Наука, технологии
- Новости
- Образование
- Политика
- Праздники
- Приколы
- Природа
- Происшествия
- Путешествия
- Развлечения
- Ржач
- Семья
- Сериалы
- Спорт
- Стиль жизни
- ТВ передачи
- Танцы
- Технологии
- Товары
- Ужасы
- Фильмы
- Шоу-бизнес
- Юмор
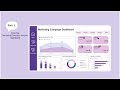
Retail Analysis Dashboard in PowerBI | Step-by-Step Tutorial |
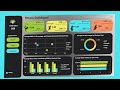
👉 Retail Analysis Dashboard in PowerBI
Explore the fascinating insights and trends within the Retail store dataset. This tutorial aims to guide you through the step-by-step process of building a Retail Analysis Dashboard Using PowerBI.
🚀 Here what’s covered:
✔️ Metrics Overview: Total Order, Delivered, Shipped, Processing and Pending metrics help to understanding order Processing efficiency, shipment performance and potential delays.
✔️ Total orders by Month stacked area chart: provides a visual representation of order trends over time.
✔️ Product Category order Donut chart: Visual represents the distribution of orders across different product categories.
✔️ Orders Table: Provides a detailed view of individual orders, allowing businesses to track each order’s status, product details and customer location.
✔️ Filled Map of order by state: Visual represents the number of orders placed in each state.
🔎 Download Background Image : https://github.com/shruthi2023/Retail_Analysis_Dashboard_in_PowerBI/tree/main
🔎Download Dataset : https://drive.google.com/drive/folders/1qBkr9z4LomGlp53xTFbrGSZVzoTes4h9?usp=sharing
💙 Come along : www.youtube.com/@Shruthi_Mahadev
🎵 Background music: “Jungle Trip - Quincas Moreira” from YouTube Audio Library
💬 Subscribe for more PowerBI tutorials and Analytics insights.
👍 Like & share if you found this useful!
#RetailAnalysisDashboardinPowerBI, #RetailStoreDashboard, #HowtoPowerBI, #DAX, #EndToEndPowerBIPoject, #Beginnerproject, #completepowerbiproject, #CreateRetailAnalysisDashboardinPowerBI #dataanalytics, #datascience
Видео Retail Analysis Dashboard in PowerBI | Step-by-Step Tutorial | канала Shruthi Mahadev
Комментарии отсутствуют
Информация о видео
29 марта 2025 г. 12:37:07
00:36:49
Другие видео канала