- Популярные видео
- Авто
- Видео-блоги
- ДТП, аварии
- Для маленьких
- Еда, напитки
- Животные
- Закон и право
- Знаменитости
- Игры
- Искусство
- Комедии
- Красота, мода
- Кулинария, рецепты
- Люди
- Мото
- Музыка
- Мультфильмы
- Наука, технологии
- Новости
- Образование
- Политика
- Праздники
- Приколы
- Природа
- Происшествия
- Путешествия
- Развлечения
- Ржач
- Семья
- Сериалы
- Спорт
- Стиль жизни
- ТВ передачи
- Танцы
- Технологии
- Товары
- Ужасы
- Фильмы
- Шоу-бизнес
- Юмор
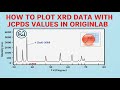
How to Plot Multiple XRD Spectra in One Graph | Origin Tutorial #9
In this tutorial, I’ll show you how to plot multiple XRD spectra in a single graph using Origin.
You’ll learn how to:
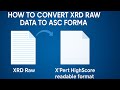
Import XRD data into Origin
Use one 2θ dataset for all samples
Create stacked line plots with Y offset
Customize your graph for a clean, professional look
Perfect for researchers, students, and anyone working with X-ray diffraction (XRD) data.
📌 Watch Next – Related Tutorials:
How to Download and Install Origin Pro 2025 for Free (Licensed Version) → https://youtu.be/5rM02VVexWo
How to Plot UV-Visible Graph in Origin || UV-Vis Spectra plotting → https://youtu.be/fqGFWUPJYrI
How to Plot TGA-DTA Data in Originlab || TGA Analysis Tutorial → https://youtu.be/A-WfVS7SLmE
How to Plot FTIR Graph in OriginPro || Label Peaks & Fix Scale || FTIR Data Analysis Tutorial → https://youtu.be/oKIPWcr_4gY
How to Plot XRD Data in Origin & Index Miller Planes | Easy Tutorial for Beginners → https://youtu.be/vPufxklEQiI
How to Plot a Reusability (Recyclability) Graph in OriginPro | Scientific Graph Tutorial → https://youtu.be/GQvSzDD3pmY
How to Draw Photocatalytic Degradation Mechanism in PowerPoint | Step-by-Step Tutorial → https://youtu.be/RI3cieln72c
How to Plot Bar Graph with Error Bars in OriginPro → https://youtu.be/0zcZrGU63Ps
👍 If this video helped you, please like, comment, and subscribe for more tutorials on data analysis and scientific visualization.
#XRD #OriginPro #DataAnalysis #ScientificVisualization #ResearchTips #GraphingTutorial #MaterialScience #XrayDiffraction #OriginTutorial #SpectraPlot
Видео How to Plot Multiple XRD Spectra in One Graph | Origin Tutorial #9 канала Nano Analysis Hub
You’ll learn how to:
Import XRD data into Origin
Use one 2θ dataset for all samples
Create stacked line plots with Y offset
Customize your graph for a clean, professional look
Perfect for researchers, students, and anyone working with X-ray diffraction (XRD) data.
📌 Watch Next – Related Tutorials:
How to Download and Install Origin Pro 2025 for Free (Licensed Version) → https://youtu.be/5rM02VVexWo
How to Plot UV-Visible Graph in Origin || UV-Vis Spectra plotting → https://youtu.be/fqGFWUPJYrI
How to Plot TGA-DTA Data in Originlab || TGA Analysis Tutorial → https://youtu.be/A-WfVS7SLmE
How to Plot FTIR Graph in OriginPro || Label Peaks & Fix Scale || FTIR Data Analysis Tutorial → https://youtu.be/oKIPWcr_4gY
How to Plot XRD Data in Origin & Index Miller Planes | Easy Tutorial for Beginners → https://youtu.be/vPufxklEQiI
How to Plot a Reusability (Recyclability) Graph in OriginPro | Scientific Graph Tutorial → https://youtu.be/GQvSzDD3pmY
How to Draw Photocatalytic Degradation Mechanism in PowerPoint | Step-by-Step Tutorial → https://youtu.be/RI3cieln72c
How to Plot Bar Graph with Error Bars in OriginPro → https://youtu.be/0zcZrGU63Ps
👍 If this video helped you, please like, comment, and subscribe for more tutorials on data analysis and scientific visualization.
#XRD #OriginPro #DataAnalysis #ScientificVisualization #ResearchTips #GraphingTutorial #MaterialScience #XrayDiffraction #OriginTutorial #SpectraPlot
Видео How to Plot Multiple XRD Spectra in One Graph | Origin Tutorial #9 канала Nano Analysis Hub
Комментарии отсутствуют
Информация о видео
14 августа 2025 г. 21:00:51
00:09:18
Другие видео канала