- Популярные видео
- Авто
- Видео-блоги
- ДТП, аварии
- Для маленьких
- Еда, напитки
- Животные
- Закон и право
- Знаменитости
- Игры
- Искусство
- Комедии
- Красота, мода
- Кулинария, рецепты
- Люди
- Мото
- Музыка
- Мультфильмы
- Наука, технологии
- Новости
- Образование
- Политика
- Праздники
- Приколы
- Природа
- Происшествия
- Путешествия
- Развлечения
- Ржач
- Семья
- Сериалы
- Спорт
- Стиль жизни
- ТВ передачи
- Танцы
- Технологии
- Товары
- Ужасы
- Фильмы
- Шоу-бизнес
- Юмор
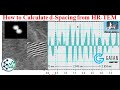
How to Calculate d-Spacing from HR-TEM Images using ImageJ | Show Interplanar Spacing on TEM #17
In this tutorial, I’ll guide you step by step on how to calculate d-spacing from HR-TEM images using ImageJ software, and then show you how to visualize the interplanar spacing directly on your TEM images using PowerPoint or Microsoft Paint.
👉 If this tutorial helps, don’t forget to Like, Comment, and Subscribe for more content on:
▶️ WATCH NEXT – RELATED TUTORIALS:
• Plotting in OriginPro:
o Plot Single XRD Pattern: https://youtu.be/vPufxklEQiI
o Plot Multiple XRD Spectra: https://youtu.be/Ql9dhDOLIX0
o Plot FTIR Spectra: https://youtu.be/oKIPWcr_4gY
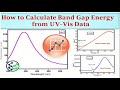
o Plot UV-Visible Spectra: https://youtu.be/fqGFWUPJYrI
o Plot TGA-DTA Data: https://youtu.be/A-WfVS7SLmE
o Bar Graph with Error Bars: https://youtu.be/0zcZrGU63Ps
o Reusability/Recycling Graph: https://youtu.be/GQvSzDD3pmY
o Draw Degradation Mechanism (PowerPoint): https://youtu.be/RI3cieln72c
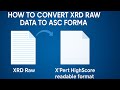
o How to Convert XRD Raw Data to ASC Format: https://youtu.be/hG-CZeNRkl4
o How to Plot Multiple FTIR Spectra in One Graph Using Origin: https://youtu.be/jTmaWsj8mLo
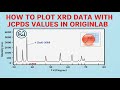
o How to Plot Multiple XRD Spectra in One Graph: https://youtu.be/Ql9dhDOLIX0
o How to Convert XRD Raw Data to ASC Format: https://youtu.be/hG-CZeNRkl4
o How to Label XRD Peaks with Miller Indices (hkl) using X’Pert HighScore: https://youtu.be/Lz5m4t7jCis
Видео How to Calculate d-Spacing from HR-TEM Images using ImageJ | Show Interplanar Spacing on TEM #17 канала Nano Analysis Hub
👉 If this tutorial helps, don’t forget to Like, Comment, and Subscribe for more content on:
▶️ WATCH NEXT – RELATED TUTORIALS:
• Plotting in OriginPro:
o Plot Single XRD Pattern: https://youtu.be/vPufxklEQiI
o Plot Multiple XRD Spectra: https://youtu.be/Ql9dhDOLIX0
o Plot FTIR Spectra: https://youtu.be/oKIPWcr_4gY
o Plot UV-Visible Spectra: https://youtu.be/fqGFWUPJYrI
o Plot TGA-DTA Data: https://youtu.be/A-WfVS7SLmE
o Bar Graph with Error Bars: https://youtu.be/0zcZrGU63Ps
o Reusability/Recycling Graph: https://youtu.be/GQvSzDD3pmY
o Draw Degradation Mechanism (PowerPoint): https://youtu.be/RI3cieln72c
o How to Convert XRD Raw Data to ASC Format: https://youtu.be/hG-CZeNRkl4
o How to Plot Multiple FTIR Spectra in One Graph Using Origin: https://youtu.be/jTmaWsj8mLo
o How to Plot Multiple XRD Spectra in One Graph: https://youtu.be/Ql9dhDOLIX0
o How to Convert XRD Raw Data to ASC Format: https://youtu.be/hG-CZeNRkl4
o How to Label XRD Peaks with Miller Indices (hkl) using X’Pert HighScore: https://youtu.be/Lz5m4t7jCis
Видео How to Calculate d-Spacing from HR-TEM Images using ImageJ | Show Interplanar Spacing on TEM #17 канала Nano Analysis Hub
HR-TEM d-spacing how to calculate d spacing in TEM ImageJ d spacing tutorial TEM analysis ImageJ FFT and IFFT TEM nanomaterial TEM analysis TEM data processing ImageJ d spacing from HR-TEM TEM ImageJ tutorial how to show interplanar spacing TEM ImageJ FFT TEM TEM lattice fringes analysis Nano Analysis Hub scientific visualization TEM TEM PowerPoint tutorial TEM Paint tutorial
Комментарии отсутствуют
Информация о видео
2 сентября 2025 г. 21:00:00
00:14:00
Другие видео канала