- Популярные видео
- Авто
- Видео-блоги
- ДТП, аварии
- Для маленьких
- Еда, напитки
- Животные
- Закон и право
- Знаменитости
- Игры
- Искусство
- Комедии
- Красота, мода
- Кулинария, рецепты
- Люди
- Мото
- Музыка
- Мультфильмы
- Наука, технологии
- Новости
- Образование
- Политика
- Праздники
- Приколы
- Природа
- Происшествия
- Путешествия
- Развлечения
- Ржач
- Семья
- Сериалы
- Спорт
- Стиль жизни
- ТВ передачи
- Танцы
- Технологии
- Товары
- Ужасы
- Фильмы
- Шоу-бизнес
- Юмор
How to Calculate Band Gap Energy from UV–Vis Data | Tauc Plot in OriginLab Tutorial
In this tutorial, I’ll guide you step by step on how to calculate the optical band-gap energy (Eg) using UV–Vis spectroscopy data.
We’ll focus on the Tauc plot method and cover:
✅ Importing and processing UV–Vis data in OriginLab
✅ Applying the Beer–Lambert law to calculate the absorption coefficient
✅ Using Tauc’s relation to determine the band-gap
✅ Distinguishing between direct and indirect band-gap materials
In the next video, I’ll explain the Kubelka–Munk method for diffuse reflectance (UV–DRS) data.
👉 If you find this tutorial helpful, don’t forget to like, comment, and subscribe to Nano Analysis Hub for more nanoscience and materials analysis tutorials!
▶️ WATCH NEXT – Related Tutorials in OriginLab & Materials Analysis:
• Plot Single XRD Pattern → https://youtu.be/vPufxklEQiI
• Plot Multiple XRD Spectra → https://youtu.be/Ql9dhDOLIX0
• Plot FTIR Spectra → https://youtu.be/oKIPWcr_4gY
• Plot UV-Visible Spectra → https://youtu.be/fqGFWUPJYrI
• Plot TGA-DTA Data → https://youtu.be/A-WfVS7SLmE
• Bar Graph with Error Bars → https://youtu.be/0zcZrGU63Ps
• Reusability/Recycling Graph → https://youtu.be/GQvSzDD3pmY
• Draw Degradation Mechanism (PowerPoint) → https://youtu.be/RI3cieln72c
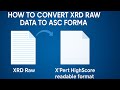
• Convert XRD Raw Data to ASC Format → https://youtu.be/hG-CZeNRkl4
• Plot Multiple FTIR Spectra in One Graph → https://youtu.be/jTmaWsj8mLo
• Label XRD Peaks with Miller Indices (hkl) → https://youtu.be/Lz5m4t7jCis
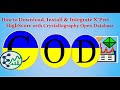
• Install & Integrate X’Pert HighScore → https://youtu.be/NWY3u69Jbh0
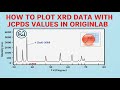
• Plot XRD Data with JCPDS Values in OriginLab → https://youtu.be/1tpjgetpRew
• Merge Multiple Graphs in OriginLab → https://youtu.be/eTItefqx5Mg
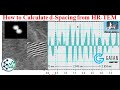
• Calculate d-Spacing from HR-TEM (Gatan DM) → https://youtu.be/Zfxugw-1IQk
• Calculate d-Spacing from HR-TEM (ImageJ) → https://youtu.be/00rMASWj2F0
#BandGap #UVVis #TaucPlot #OriginLab #Nanomaterials #MaterialsScience #Spectroscopy
Видео How to Calculate Band Gap Energy from UV–Vis Data | Tauc Plot in OriginLab Tutorial канала Nano Analysis Hub
We’ll focus on the Tauc plot method and cover:
✅ Importing and processing UV–Vis data in OriginLab
✅ Applying the Beer–Lambert law to calculate the absorption coefficient
✅ Using Tauc’s relation to determine the band-gap
✅ Distinguishing between direct and indirect band-gap materials
In the next video, I’ll explain the Kubelka–Munk method for diffuse reflectance (UV–DRS) data.
👉 If you find this tutorial helpful, don’t forget to like, comment, and subscribe to Nano Analysis Hub for more nanoscience and materials analysis tutorials!
▶️ WATCH NEXT – Related Tutorials in OriginLab & Materials Analysis:
• Plot Single XRD Pattern → https://youtu.be/vPufxklEQiI
• Plot Multiple XRD Spectra → https://youtu.be/Ql9dhDOLIX0
• Plot FTIR Spectra → https://youtu.be/oKIPWcr_4gY
• Plot UV-Visible Spectra → https://youtu.be/fqGFWUPJYrI
• Plot TGA-DTA Data → https://youtu.be/A-WfVS7SLmE
• Bar Graph with Error Bars → https://youtu.be/0zcZrGU63Ps
• Reusability/Recycling Graph → https://youtu.be/GQvSzDD3pmY
• Draw Degradation Mechanism (PowerPoint) → https://youtu.be/RI3cieln72c
• Convert XRD Raw Data to ASC Format → https://youtu.be/hG-CZeNRkl4
• Plot Multiple FTIR Spectra in One Graph → https://youtu.be/jTmaWsj8mLo
• Label XRD Peaks with Miller Indices (hkl) → https://youtu.be/Lz5m4t7jCis
• Install & Integrate X’Pert HighScore → https://youtu.be/NWY3u69Jbh0
• Plot XRD Data with JCPDS Values in OriginLab → https://youtu.be/1tpjgetpRew
• Merge Multiple Graphs in OriginLab → https://youtu.be/eTItefqx5Mg
• Calculate d-Spacing from HR-TEM (Gatan DM) → https://youtu.be/Zfxugw-1IQk
• Calculate d-Spacing from HR-TEM (ImageJ) → https://youtu.be/00rMASWj2F0
#BandGap #UVVis #TaucPlot #OriginLab #Nanomaterials #MaterialsScience #Spectroscopy
Видео How to Calculate Band Gap Energy from UV–Vis Data | Tauc Plot in OriginLab Tutorial канала Nano Analysis Hub
Комментарии отсутствуют
Информация о видео
7 сентября 2025 г. 21:00:33
00:20:15
Другие видео канала