Sensitivity Analysis in Finance | Calculating Break-Even Point
We learn how to use sensitivity analysis in finance to calculate the break-even point of a business in a variety of different situations. Excel template included!
RESOURCES & LINKS:
____________________________________________
► Sensitivity Analysis Finance Template Download: http://bit.ly/sensbrkvn_mlchmp
🚨 Join my Finance for Startups training program (with personalized support, livestreams, and more): https://bit.ly/finance_for_startups
Join My Communities:
► Subscribe to my email newsletter: http://bit.ly/joinericnewsletter
► Discord: https://discord.gg/gHghhVcW3S
My Excel Courses:
► Become an Excel Power User in 2.5 Hours (85% discount): http://bit.ly/excelpwrusr5-21
► Master Excel Keyboard Shortcuts (85% discount): http://bit.ly/shortcuts5-21
Related Financial Modeling Videos:
► Build a 3 Statement Financial Model: https://youtu.be/xlXDZyZ9azk
► Solving a Finance Case Study | Interview Prep: https://youtu.be/KB5BEnK0Jzo
► SaaS Financial Model Tutorial | Scaling to $1 Billion: https://youtu.be/C7S6lXu4NS4
► Top 10 Startup Metrics Used by VCs: https://youtu.be/tuXILsUljKc
____________________________________________
In this video we learn about how to analyze businesses, think about different possible break-even situations, and most importantly use sensitivity analysis to zero-in on how we hit our profitability targets.
Knowing how to perform sensitivity analysis in finance roles is one of the things that will differentiate you from other candidates.
First off - what is sensitivity analysis?
This function lets you look at different combinations of variables (say, different prices + return rates, etc) and analyze one particular metric in each situation - in the case of break-even points, that metric is the profit.
But the issue is that looking at each scenario individually (say, $50 price and 30% return rate = $XYZ profit) is extremely slow. You need a way to look at dozens or hundreds of combinations of assumptions in one simple table - that's where sensitivity analysis comes in.
To find this function go to the "Data" tab in Excel, under the "What-If-Analysis" group click "Data Table".
Sections:
0:08 what is sensitivity analysis & what-if-analysis
0:56 understanding the assumptions of our income statement
3:38 situation: investors want us to break even in year 2 or 3
4:01 how to setup sensitivity analysis table (1st table)
7:30 second breakeven point analysis - COGS vs. ad spend (2nd table)
10:50 sensitivity analysis with only one changing variable (3rd table)
By the end of this lesson you will be confident using sensitivity analysis in finance to analyze break even points of businesses.
If you have questions - please leave a comment below and I'll try to help. Cheers!
► Subscribe for more finance videos: https://bit.ly/EricAndrewsSubscribe
#sensitivityanalysis #financialmodeling
Видео Sensitivity Analysis in Finance | Calculating Break-Even Point канала Eric Andrews
Показать
Комментарии отсутствуют
Информация о видео
Другие видео канала
 Discounted Cash Flow Model | Quickly Value a Business
 Data Sensitivity Analysis in Excel - What If Data Tables
 Sensitivity Analysis - Microsoft Excel
 3 Statement Financial Model | Building From Scratch
 How to Build a Basic Financial Model in Excel
 How to Calculate Break Even Point in Sales Revenue (Learn the Easy Way)
 Finance Interview Questions & Answers | For Entry-Level Roles!
 Sensitivity Analysis for Financial Modeling
 Startup Metrics & KPIs | Top 10 Metrics Used by VCs
![Monthly Budgeting & Forecasting Model [Template Included]](https://i.ytimg.com/vi/yJcL4et-ClY/default.jpg) Monthly Budgeting & Forecasting Model [Template Included]
Monthly Budgeting & Forecasting Model [Template Included] How to perform simple one and two way Sensitivity Analyses using Data Tables in Excel
 Cash Flow Statement Explained: Demystifying Cash Flow with an Example
 How to Calculate Customer Lifetime Value | The #1 Most Important Metric in Ecommerce
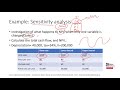 Scenario, Sensitivity and Break-even analysis
 Net Present Value & IRR | How to Calculate in Excel
 SaaS Financial Model Tutorial | Scaling a Software Startup to $1 Billion
 Break Even Analysis using Excel
 What is Financial Modeling? Explanation & Setup of a Financial Model
 Sensitivity and Scenario Analysis Model