Sensitivity Analysis - Microsoft Excel
Example of how to build a sensitivity analysis table in Excel to evaluate how changing two inputs simultaneously will affect an output (profit). This is one of the functions on the "What-If-Analysis" section of Excel.
RESOURCES & LINKS:
____________________________________________
► Download Free Sensitivity Analysis Template: https://bit.ly/sensanaly_mlchmp
My Courses:
► Become an Excel Power User in 2.5 Hours (85% discount): http://bit.ly/excelpwrusr5-21
► Master Excel Keyboard Shortcuts (85% discount): http://bit.ly/shortcuts5-21
Related Financial Modeling Videos:
► Solving a Finance Case Study | Interview Prep: https://youtu.be/qURd_jDrQsI
► What is Financial Modeling? https://youtu.be/RghUyVCSdM4
► Demystifying the Cash Flow Statement: https://youtu.be/BS6_RsuqzwE
► Build a 3 Statement Financial Model: https://youtu.be/xlXDZyZ9azk
► Top 10 Startup Metrics Used by VCs: https://youtu.be/tuXILsUljKc
► Subscribe for more finance videos: https://bit.ly/EricAndrewsSubscribe
► Join the discussion on Facebook: https://www.facebook.com/ericandrewsfinance
____________________________________________
Sensitivity analysis in Excel is one of the skills that separates the common Excel user from the power user.
Often we try to analyze business problems my thinking about what will happen if certain things change. For instance, what happens if we change the price? Well, the revenue would go up if we just changed price for a business, but total customers stayed the same.
However, the reality is that in reality, you never have scenarios where one variable changes, but everything else stays the same. There are always repercussions. When you raise the price, usually some customers will stop buying, but some will continue.
So when trying to analyze situations, it is better to try to build models and analyses that reflect many different variables changing at the same time.
This is where sensitivity analysis comes in. Using this Excel feature, we are able to examine how multiple changing variables will affect different business metrics. To do this, we can build a "sensitivity data table" to examine the range of possible outcomes.
In this tutorial, we learn how to build a sensitivity analysis table in Excel 2016 to evaluate how changing two inputs simultaneously will affect an output (profit).
#sensitivityanalysis #excel
I hope you enjoyed this tutorial, please subscribe to my channel:
► Subscribe for more finance videos: https://bit.ly/EricAndrewsSubscribe
If you'd like to improve your skills and resume, I built a business-focused Excel course on Udemy that teaches the 20% of Excel used for 80% of business.
Thousands of people from over 80 countries have taken the course, with the skills helping them pass college exams, receive job offers, and even get raises. Take a look at the reviews!
Видео Sensitivity Analysis - Microsoft Excel канала Eric Andrews
Показать
Комментарии отсутствуют
Информация о видео
Другие видео канала
 Data Sensitivity Analysis in Excel - What If Data Tables
 Sensitivity Analysis for Financial Modeling Course | Corporate Finance Institute
 Sensitivity Analysis in Finance | Calculating Break-Even Point
 Sensitivity Analysis in Excel
 Discounted Cash Flow Model | Quickly Value a Business
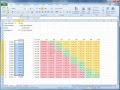 Excel's Business Tools - What-if Analysis
 Excel WhatIf Analysis with Scenario Manager and Goal Seek
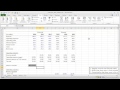 Financial Modeling Quick Lesson: OFFSET / MATCH and Data Validation (Part 1)
 Scenario Analysis - How to Build Scenarios in Financial Modeling
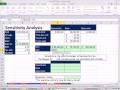 Excel Finance Class 89: Sensitivity Analysis For Cash Flow & NPV Calculations
 Excel Data Tables - Easy What-if Analysis for Multiple Variables
 Sensitivity Analysis - What-If Scenarios In Real Estate Financial Modeling
 Sensitivity Analysis and Tornado Plots
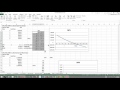 NPV, IRR, MIRR, and Data Tables
 IRR Calculation and IRR Sensitivity Table
 LP Sensitivity Analysis - Interpreting Excel's Solver Report
 Scenario & Sensitivity Analysis Model
 3+ way data table in MS Excel. Expand a 2 way data table what-if to 3, 4 or 5 input variables.
 Excel Crash Course for Finance Professionals - FREE | Corporate Finance Institute