How to perform simple one and two way Sensitivity Analyses using Data Tables in Excel
A short tutorial how to perform simple one (checking the effects of one variable, e.g. price on another variable of interest, e.g. profit) and two way (checking the effect of two variables at the same time, e.g. price and cost, on another variable of interest, e.g. profit) Sensitivity Analyses using Data Tables in Excel
Видео How to perform simple one and two way Sensitivity Analyses using Data Tables in Excel канала Data Science at INCAE
Видео How to perform simple one and two way Sensitivity Analyses using Data Tables in Excel канала Data Science at INCAE
Показать
Комментарии отсутствуют
Информация о видео
Другие видео канала
 Data Sensitivity Analysis in Excel - What If Data Tables
 Sensitivity Analysis for Financial Modeling
 Sensitivity Analysis and Tornado Plots
 How to use Excel Index Match (the right way)
 Excel Conditional Formatting with Formula | How to Get it RIGHT Every Time
 How To Read An Annual Report (10-K)
 Sensitivity Analysis in Finance | Calculating Break-Even Point
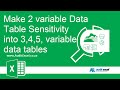 3+ way data table in MS Excel. Expand a 2 way data table what-if to 3, 4 or 5 input variables.
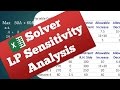 LP Sensitivity Analysis - Interpreting Excel's Solver Report
 Introduction to Pivot Tables, Charts, and Dashboards in Excel (Part 1)
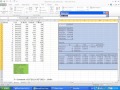 Using Multiple Regression in Excel for Predictive Analysis
 Compare Two Lists Using the VLOOKUP Formula
 Sensitivity Analysis - Microsoft Excel
 Radiant Tutorial: Logistic Regression in Radiant
 Introduction to Decision Trees in Excel (TreePlan Add-In)
 Intermediate Excel Skills, Tips, and Tricks Tutorial
 Excel Data Tables - Easy What-if Analysis for Multiple Variables
 Excel Highlight rows and records
 How To Pass Microsoft Excel Test - Get ready for the Interview
 Sensitivity Analysis - What-If Scenarios In Real Estate Financial Modeling