Control Charts For Variables
Комментарии отсутствуют
Информация о видео
Другие видео канала
 CONTROL CHART BASICS and the X-BAR AND R CHART +++++ EXAMPLE
 Create a Basic Control Chart
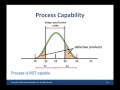 process capability and process capability index
 The 7 Quality Control (QC) Tools Explained with an Example!
 Quality Control Part 2 (Control Charts for Variables X bar and R bar charts)
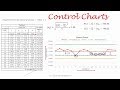 How Control Charts Control the Process Quality between Control Limits; UCL & LCL | 7 QC Tools
 Statistical Process Control Overview and Basic Concepts - What You Need to Know for the CQE Exam
 Xbar-R and Xbar-s chart: Detailed illustration with Practical Examples
 Quality (Part 1: Statistical Process Control)
 HOW TO CREATE CONTROL CHARTS ON EXCEL | Step by Step guide by Lean6Sigma
 Attribute Data Control Chart Examples!! How to select/create the P, NP, C and U Charts
 XBar-R Control Charts
 Process Capability Part I - Cp
 #21 Control Charts for Variables & Attributes - R,X,P,C charts in SQC |MS|
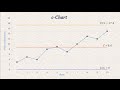 SPC 4: c - chart (Control Chart for number defective)
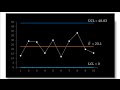 Statistical Process Control | R-Chart (Control Chart for Ranges)
 Statistical Process Control: Control Charts for Proportions (p-chart)
 SPC - xbar and s chart Example by Hand
 Statistical Process Control (SPC) - English Version
 Statistical Process Control | Chart for Means (x-bar chart)