CONTROL CHART BASICS and the X-BAR AND R CHART +++++ EXAMPLE
: The control chart basics, including the 2 types of variation and how we distinguish between common and special cause variation, along with how to create a rational subgrouping!
We also cover the equations and constants for the X-bar and R (Range) chart, and work an example of this important control chart.
1:29 – The 2 Types of Variation
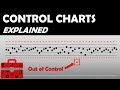
2:42 – How to distinguish between common and special cause variation (The Key Elements of a Control Chart)
3:44 –RATIONAL SUBGROUPING explained
5:29 – EQUATIONS for the control limits create an X-Bar and R Chart
6:53 – CONSTANTS needed to calculate the control limits for the X-Bar and R Chart
8:28 – EXAMPLE of an X-bar and R Chart
Learn More at www.CQEAcademy.com
Get a free course on the Top 10 Topics on the CQE Exam:
www.CQEAcademy.com/freecourse
Видео CONTROL CHART BASICS and the X-BAR AND R CHART +++++ EXAMPLE канала CQE Academy
We also cover the equations and constants for the X-bar and R (Range) chart, and work an example of this important control chart.
1:29 – The 2 Types of Variation
2:42 – How to distinguish between common and special cause variation (The Key Elements of a Control Chart)
3:44 –RATIONAL SUBGROUPING explained
5:29 – EQUATIONS for the control limits create an X-Bar and R Chart
6:53 – CONSTANTS needed to calculate the control limits for the X-Bar and R Chart
8:28 – EXAMPLE of an X-bar and R Chart
Learn More at www.CQEAcademy.com
Get a free course on the Top 10 Topics on the CQE Exam:
www.CQEAcademy.com/freecourse
Видео CONTROL CHART BASICS and the X-BAR AND R CHART +++++ EXAMPLE канала CQE Academy
Показать
Комментарии отсутствуют
Информация о видео
Другие видео канала
 Control Charting Explained (SPC)
 PROCESS CAPABILITY: Explaining Cp, Cpk, Pp, Ppk and HOW TO INTERPRET THOSE RESULTS
 XBar-R Control Charts
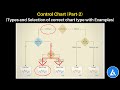 Control chart: Types and Selection of correct chart type with Practical Examples
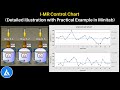 I-MR Control Chart: Detailed illustration with Practical Example
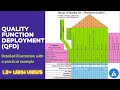 QFD (Quality Function Deployment): illustration with practical example (PART-1)
 Xbar-R and Xbar-s chart: Detailed illustration with Practical Examples
 PDCA (PLAN – DO – CHECK -ACT) CYCLE | PDSA Cycle | Problem Solving!
 Acceptance Sampling and ANSI Z1.4 Sampling Procedure Explained
 Xbar and R chart I Create Control chart in Excel I Create Xbar R chart in Excel | 7 QC Tools
 process capability and process capability index
 Intro to the Normal Distribution and how to Calculate Probability
 Statistical Process Control | R-Chart (Control Chart for Ranges)
 Create a Basic Control Chart
 How to make Run Chart and Control Chart
 Statistical Process Control | Chart for Means (x-bar chart)
 Gage R&R Study (Crossed): Illustration with Practical Example (MSA PART-6)
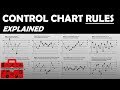 Control Charting Rules & Interpreting Control Charts
 Explaining the Cost of Quality, the 4 Cost Categories and Juran’s Quality Cost Curve
 Process Capability Part I - Cp