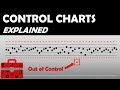
Control Charting Rules & Interpreting Control Charts
This video discusses in depth the eight control charting rules known as Nelson's rules. I go over the history of control charting rules including Walter Shewhart and the Western Electric Rules. Then I go into detail on how to interpret each rule, some control charting examples, and some general considerations and concepts to keep in mind.
Dr. Wheeler Article (Quality Digest: "When Should We Use Extra Detection Rules?"):
https://www.qualitydigest.com/inside/statistics-column/when-should-we-use-extra-detection-rules-100917.html
What do the rules Do?: [0:30]
Basic Example: [0:51]
History and Intro to 8 Rules: [1:17]
Walter Shewhart: [1:28]
General Electric Rules: [1:43]
Nelson's Rules: [2:22]
Each Rule in Depth: [3:33]
Rule #1 (GT 3s from mean): [3:35]
Rule #2 (9 IAR same side of mean): [3:55]
Rule #3 (6 IAR increase/decrease): [4:12]
Rule #4 (14 IAR alternate inc./dec.): [4:52]
Rule #5 (2/3 GT 2s from mean): [5:25]
Rule #6 (4/5 GT 1s from mean): [5:33]
Achieving Max Chart Sensitivity: [5:39]
Rule #7 (15 IAR within 1s of mean): [5:53]
Rule #8 (8 IAR Outside 1s both sides): [7:19]
Considerations and Other info: [7:43]
False Positives (False Alarm) Risks: [8:24]
Power Gained By Adding Rules: [8:44]
When can I use additional Rules?: [9:08]
Using Rules on Secondary Charts: [9:26]
- - - - - - - - - - - - - - - - - - - -
Control Chart basics: [https://youtu.be/Ugcb7Vlp0Ts]
Control Chart in Excel: [https://www.youtube.com/watch?v=cIP4PcGlZyM]
Full Control Chart Playlist: [https://www.youtube.com/playlist?list=PLAVcy54svuke4wGIv6kbP3uoLqiHT5f0g]
- - - - - - - - - - - - - - - - - - - -
Check out my channel for more videos and tutorials for engineers!
Like, follow, share and don't be afraid to drop me a comment/message with feedback, questions, or video suggestions!
Thanks for watching!
Channel Link: https://www.youtube.com/channel/UCX-H7IOnCfHihvtnypTORMA
- - - - - - - - - - - - - - - - - - - -
Other great content!
Top Free Engineering Software:
https://www.youtube.com/watch?v=PE5hMaQBCn4
Removing Outlier from Excel Pivot Table (Pt 1):
https://www.youtube.com/watch?v=p8mg3EEt6Gw
- - - - - - - - - - - - - - - - - - - -
Follow and interact!
Twitter: https://twitter.com/TheEngToolbox
Facebook: https://www.facebook.com/TheEngineeringToolbox/
- - - - - - - - - - - - - - - - - - - -
#SPC
#ControlCharting
#EngineeringToolbox
#EngineeringTutorials
#Engineering
Видео Control Charting Rules & Interpreting Control Charts канала The Engineering Toolbox Channel
Показать
Комментарии отсутствуют
Информация о видео
2 января 2019 г. 0:34:19
00:11:20
Другие видео канала
 Control Charting Explained (SPC)
 CONTROL CHART BASICS and the X-BAR AND R CHART +++++ EXAMPLE
 The 7 Quality Control (QC) Tools Explained with an Example!
 What is a Control Chart?
 Interpretation of control charts I How to interpret control charts I control charts I SPC | 7QC Tool
 Python Pandas Tutorial (Part 8): Grouping and Aggregating - Analyzing and Exploring Your Data
 Making a Control Chart in Excel (with dynamic control lines!)
 Attribute Control p-Charts Variable Subgroup Size
 The Difference Between Quality Assurance and Quality Control
 Control Chart : Detailed History, All Concepts & Nelson Rules
 Multi V Die blocks,standard press brake tooling,punch and die
 WESTGARD CONTROL CHART
 Quality (Part 1: Statistical Process Control)
 Optimal V-Die Selection Formula for Sheet Metal Air Bending
 Run Charts in Quality Improvement
 I-MR Control Chart: Detailed illustration with Practical Example
 Control Chart Interpretation
 Create Control Charts (X-Bar & R Chart) in Excel
 Bolt Tension Basics in Two Minutes
 8 rules of spc, 8 rules of control chart, SPC, 8 rules of statistical process control