Statistical Process Control: Control Charts for Proportions (p-chart)
This video explains how to calculate centreline, lower control limit, and upper control limit for the p-chart. Equal and unequal sample sizes are discussed.
~~~~~~~~~~~
This channel does not contain ads.
Support my channel: https://www.paypal.me/joshemman
~~~~~~~~~~~
How to Construct a Control Chart in Excel:
https://youtu.be/PtCp7uJwIGI
See also
c-chart
https://youtu.be/RvEjgsYkTZk
x-bar chart
https://youtu.be/RiKUZqW41UM
R-chart
https://youtu.be/0CtJJGprG6A
Видео Statistical Process Control: Control Charts for Proportions (p-chart) канала Joshua Emmanuel
~~~~~~~~~~~
This channel does not contain ads.
Support my channel: https://www.paypal.me/joshemman
~~~~~~~~~~~
How to Construct a Control Chart in Excel:
https://youtu.be/PtCp7uJwIGI
See also
c-chart
https://youtu.be/RvEjgsYkTZk
x-bar chart
https://youtu.be/RiKUZqW41UM
R-chart
https://youtu.be/0CtJJGprG6A
Видео Statistical Process Control: Control Charts for Proportions (p-chart) канала Joshua Emmanuel
Показать
Комментарии отсутствуют
Информация о видео
Другие видео канала
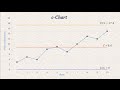 SPC 4: c - chart (Control Chart for number defective)
 Create a Basic Control Chart
 SQC (Product control charts) or Types of Control or Attribute charts.
 Process Capability Part I - Cp
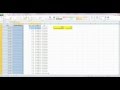 How To... Draw a Basic Control Chart in Excel 2010
 Process Capablity Part II - Cp & Cpk
 #57 Statistical quality control ( c- chart with practical Question)
 Control Chart in English
 p Control Charts
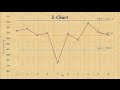 Statistical Process Control | Chart for Means (x-bar chart)
 Attribute Control p-Charts Variable Subgroup Size
 Control chart: np chart step by step
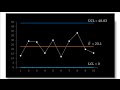 Statistical Process Control | R-Chart (Control Chart for Ranges)
 Control Chart : Detailed History, All Concepts & Nelson rules used for special cause identification
 #45 Statistical quality control ( p chart with detailed explanation)
 Control Limits for p-chart by hand
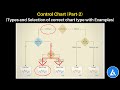 Control chart: Types and Selection of correct chart type with Practical Examples
 C Chart
 QC101 Attribute Control Charts P & NP Charts