Can BMW improve their Report? Graph Vs. Excel Table (Part 1)
Check the Excel Essentials Course: https://courses.xelplus.com/p/learn-excel-essentials
In this case study we take a look at the 2015 Annual Report from BMW and look at ways we could improve on some of the tables and graphs used in the report. Of course I will use Microsoft Excel for this. It's sometimes difficult to decide which visualization to use for which data sets. Specially when it comes to visualizing financial numbers in corporate reports. Sometimes it helps to test different versions - which you can easily do in Excel and then put them side by side. Or give the different versions as handouts to your team and decide which is the easiest and fastest to read.
⯆ Download the workbook here: http://www.xelplus.com/bmw-report-makeover-graph-versus-table/
View Part 2: Alternative to Donut charts https://youtu.be/U3U5A0BCr9A
View Part 3: Better Excel Tables https://youtu.be/xLmi3PUDg9k
In this video we take a look at a specific table which compares sales volume of 2015 by Mini model with previous year's values. In addition it shows the proportion of sales volume for each Mini Model as compared to the total. There is a lot of information in the table. Could we show this better with a chart? or should we stick to a table?
Link to BMW 2015 Annual report: http://bit.ly/BMWPDF2015
★ My Online Excel Courses ► https://courses.xelplus.com/
✉ Subscribe & get my TOP 10 Excel formulas e-book for free
https://www.xelplus.com/free-ebook/
EXCEL RESOURCES I Recommend: https://www.xelplus.com/resources/
Get Office 365: https://microsoft.msafflnk.net/15OEg
Microsoft Surface: https://microsoft.msafflnk.net/c/1327040/451518/7593
GEAR
Screen recorder: http://techsmith.pxf.io/c/1252781/347799/5161
Main Camera: https://amzn.to/3a5ldBs
Backup Camera: https://amzn.to/2FLiFho
Main Lens: https://amzn.to/39apgeD
Zoom Lens: https://amzn.to/3bd5pN7
Audio Recorder: https://amzn.to/2Uo5rLm
Microphone: https://amzn.to/2xYy9em
Lights: http://amzn.to/2eJKg1U
More resources on my Amazon page: https://www.amazon.com/shop/leilagharani
Note: This description contains affiliate links, which means at no additional cost to you, we will receive a small commission if you make a purchase using the links. This helps support the channel and allows us to continue to make videos like this. Thank you for your support!
#MsExcel
Видео Can BMW improve their Report? Graph Vs. Excel Table (Part 1) канала Leila Gharani
Показать
Комментарии отсутствуют
Информация о видео
Другие видео канала
 Alternative to Doughnut Charts: BMW report study (Part 2)
 5 Design Tips for Better Excel Reports & Dashboards
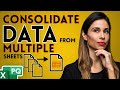 Consolidate & Clean Multiple Excel Sheets in One Pivot Table
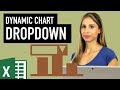 Excel Dynamic Chart with Drop down List (column graph with average line)
 Do's & Don'ts of Excel Spreadsheet Design (with Examples)
 6 FREE Add-Ins for Excel to Start Using Now
 Excel Picture Lookup: 5 easy steps for dynamic images
 Progress Circle Chart in Excel as NEVER seen before!
 5 Excel Functions YOU NEED in 2021
 How Power Query Will Change the Way You Use Excel
 Excel Stock Portfolio Dashboard
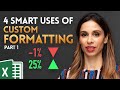 4 SMART Ways to use Custom Formatting instead of Conditional Formatting in Excel - Part 1
 How To Import & Clean Messy Accounting Data in Excel | Use Power Query to Import SAP Data
 Project Plan in Excel with Gantt Chart (Plan, Actual & Progress in ONE VIEW)
 Excel VBA tutorial for beginners: The Visual Basic Editor (VBE)
 Master Excel's SUMPRODUCT Formula
 Return Multiple Match Results in Excel (2 methods)
 This Excel Chart will grab your attention (Infographic template included)
 How to Create & Use Excel Macros (Real world example)