Open Source Historian: Grafana & InfluxDB
Demonstrates how to setup an open source historian to view process data using easy to install docker images. Shows how Modbus TCP data is inserted with NodeRED and how a WAGO PFC can log data using simple the curl http POST api.
Here are some of the commands used:
sudo docker network create -d bridge wago
curl -sSL https://get.docker.com | sh
sudo usermod -aG docker pi
sudo docker volume create grafana-storage
docker run -d -p 3000:3000 --network="wago" --name=grafana -v grafana-storage:/var/lib/grafana grafana/grafana
sudo docker run -p 8086:8086 -v influxdb:/var/lib/influxdb influxdb
sudo docker run -d -p 8086:8086 --name=influxdb --network="wago" -v /home/pi/influxdb.conf:/etc/influxdb/
curl http://192.168.4.14:8086/query --data-urlencode 'q=CREATE DATABASE "mydb"'
curl -i -XPOST "http://192.168.4.14:8086/write?db=mydb&precision=s" --data-binary 'myvar,mytag=1 myfield=90 1549412796'
curl -G 'http://192.168.4.14:8086/query?db=mydb' --data-urlencode 'q=SELECT * FROM "myvar"'
Parts used:
WAGO
750-352 Ethernet Coupler ModbusTCP
750-1506 8ch DI/DO 24VDC Module
750-461 RTD Module
750-600 End Module
787-1602 24VDC 1A PS
789-801 DIN push button
--
750-8202 PFC200 Controller
750-1506 8ch DI/DO module
750-600 End Module
---
Raspberry Pi 3b +
DIN Rail mount: www.DINrPlate.com
If hosting all containers on the WAGO Controller here are alternative commands;
(Install NodeRED)
docker volume create --name node_red_user_data
docker run --restart unless-stopped -d --name node-red --network=host -v node_red_user_data:/data nodered/node-red
(Install Grafana)
docker volume create grafana-storage
docker run -d --name=grafana --network=host --restart unless-stopped -v /etc/localtime:/etc/localtime grafana/grafana
(Install InfluxDB)
docker run -d --name=influxdb --network=host --restart unless-stopped influxdb
Видео Open Source Historian: Grafana & InfluxDB канала Kurt Braun
Показать
Комментарии отсутствуют
Информация о видео
Другие видео канала
 #255 Node-Red, InfluxDB, and Grafana Tutorial on a Raspberry Pi
 you need to learn Docker RIGHT NOW!! // Docker Containers 101
 Introduction to Time Series Databases
 Grafana Explained in Under 5 Minutes ⏲
![Michael Desa [InfluxData] | InfluxDB 101 – Concepts and Architecture | InfluxDays London 2019](https://i.ytimg.com/vi/S1kuOyS8FHY/default.jpg) Michael Desa [InfluxData] | InfluxDB 101 – Concepts and Architecture | InfluxDays London 2019
Michael Desa [InfluxData] | InfluxDB 101 – Concepts and Architecture | InfluxDays London 2019 ELI5 - What I Learned Teaching Grafana to My Kids
 Grafana at CERN
 NodeRED Multi-Node Redundancy Example
![Intro to Time Series Databases & Data | Getting Started [1 of 7]](https://i.ytimg.com/vi/OoCsY8odmpM/default.jpg) Intro to Time Series Databases & Data | Getting Started [1 of 7]
Intro to Time Series Databases & Data | Getting Started [1 of 7] InfluxDB, Grafana, Glances & IDE in Home Assistant within 15 minutes!
 #295 Raspberry Pi Server based on Docker, with VPN, Dropbox backup, Influx, Grafana, etc: IOTstack
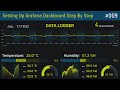 How To Setup A Grafana Dashboard Step By Step
![David Simmons [InfluxData] | InfluxDB for IoT](https://i.ytimg.com/vi/lnBWIMqd6bo/default.jpg) David Simmons [InfluxData] | InfluxDB for IoT
David Simmons [InfluxData] | InfluxDB for IoT How to Install Grafana on Home Assistant ?? EASY 😉
 How to Get Started with MQTT
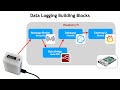 SuperHouse #41: Datalogging with MQTT, Node-RED, InfluxDB, and Grafana
 Build Grafana 7.2 Dashboard from OPC UA DataSource
 Running a Power Plant with Grafana
 IP Camera RTSP & Node-RED Tutorial
 Home power monitoring using the Shelly EM with Grafana, InfluxDB, Node-RED and MQTT