How To Setup A Grafana Dashboard Step By Step
In this tutorial video, we're visualising the data we've been gathering with our application from our tutorial number 8.
In order to do that, we download and install Grafana and then setup a dashboard step by step.
Sections:
01:02 Downloading Grafana for Windows 10
01:22 Installing Grafana in Windows 10
01:37 Opening Grafana and logging in
01:59 Connecting Grafana to the MariaDB database
02:30 Adding panels to the dashboard
12:45 Changing the design of the panels
Recommended videos:
Video T008: https://www.youtube.com/watch?v=FUi4iqz3Pn8
Visit us on https://www.sql4automation.com
Видео How To Setup A Grafana Dashboard Step By Step канала SQL4automation
Показать
Комментарии отсутствуют
Информация о видео
Другие видео канала
 ELI5 - What I Learned Teaching Grafana to My Kids
 How Prometheus Monitoring works | Prometheus Architecture explained
 Logging Sensor Data From Siemens S7 PLC To MariaDB SQL Database
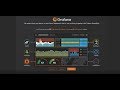 Configure Grafana With Zabbix Tutorial
 Grafana Loki: Like Prometheus, But for logs. - Tom Wilkie, Grafana Labs
 you need to learn Docker RIGHT NOW!! // Docker Containers 101
 Create beautiful dashboards with Grafana.
![Intro to Time Series Databases & Data | Getting Started [1 of 7]](https://i.ytimg.com/vi/OoCsY8odmpM/default.jpg) Intro to Time Series Databases & Data | Getting Started [1 of 7]
Intro to Time Series Databases & Data | Getting Started [1 of 7] Grafana-Installation und erstes Dashboard anlegen | haus-automatisierung.com
 Visualize pfSense Logs in Grafana | Beautiful Graphs for logs via Graylog
 #255 Node-Red, InfluxDB, and Grafana Tutorial on a Raspberry Pi
 Running a Power Plant with Grafana
 How to create Grafana Dashboards: The Easy way
 Guide to Grafana 101: Getting Started with (awesome) Visualizations
 How to get email alerts from grafana to gmail or your internal smtp server
 Home automation dashboard tutorial using Home Assistant, InfluxdB and Grafana
 Grafana 7.0 feature: auto grid layout
 Guide to Grafana 101: Advanced Topics & Pro Tips
 Grafana vs Kibana | Beautiful data graphs and log analysis systems
 #11 Grafana Monitoring | FREE Beginner course | Collect vSphere Metrics