Grafana Explained in Under 5 Minutes ⏲
In this video I introduce you to Grafana and provide a high level overview of how it works and what it looks like.
Grafana is an open source web application commonly used for monitoring resources and data visualization
The dashboard you see in the video can be found here: https://play.grafana.org/
Introduction: 00:00 - 00:21
Architecture Overview: 00:22 - 02:30
Types of Data in Grafana: 02:31- 03:02
Sample Grafana Dashboard: 03:03 - 04:04
Conclusion: 04:05 - 04:32
Видео Grafana Explained in Under 5 Minutes ⏲ канала Tech and Beyond With Moss
Показать
Комментарии отсутствуют
Информация о видео
6 октября 2020 г. 3:17:32
00:04:32
Другие видео канала
 Grafana Dashboard📊: Monitor CPU, Memory, Disk and Network Traffic Using Prometheus and Node Exporter
 Introduction to Prometheus monitoring
 Guide to Grafana 101: Getting Started with (awesome) Visualizations
 Grafana Vs Kibana | All You Need to Know !!! #Grafana #Kibana
 Grafana Loki: Like Prometheus, But for logs. - Tom Wilkie, Grafana Labs
 Grafana Tutorial For Beginners | Continuous Monitoring With Grafana | DevOps Training | Edureka
 The Business of Grafana
 TOP 5 INVESTMENTS Of All Time - For Passive Income
 Terraform explained in 15 mins | Terraform Tutorial for Beginners
 #255 Node-Red, InfluxDB, and Grafana Tutorial on a Raspberry Pi
 Trading 101: How Does the Stock Market Work?
 Grafana vs Kibana | Beautiful data graphs and log analysis systems
 Introduction to Grafana Variables and Templates with Prometheus 📊
![Intro to Time Series Databases & Data | Getting Started [1 of 7]](https://i.ytimg.com/vi/OoCsY8odmpM/default.jpg) Intro to Time Series Databases & Data | Getting Started [1 of 7]
Intro to Time Series Databases & Data | Getting Started [1 of 7] SuperHouse #41: Datalogging with MQTT, Node-RED, InfluxDB, and Grafana
 How Prometheus Monitoring works | Prometheus Architecture explained
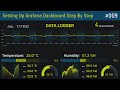 How To Setup A Grafana Dashboard Step By Step
 Analítica y monitorización con la plataforma Grafana desde 0
 Setup Prometheus Monitoring on Kubernetes using Helm and Prometheus Operator | Part 1
 How to Invest in Stocks for Beginners 2021 | Step by Step Guide