Bar Graphs and Histograms using Geogebra
Bar Graphs and Histograms
Bar graphs and histograms look very similar, but they are used for different types of data. A bar graph is typically used to represent categorical or discrete data where histograms are typically used to present numerical or quantitative data.
Bar Graphs: Usually have spaces between the bars. The order of the data does not matter except for convenience.
Sample Data:
A sample of 205 students were asked their favorite fruit. Here is the data.
banana 50
apple 60
orange 25
blueberry 10
watermelon 60
A = {1,2,3,4,5}
B = {50, 60, 25, 10, 60]
BarChart[A,B, .7]
Histograms: These are used to compare numbers of data grouped into intervals. Order matters in the data depicted.
Ages of Presidents at Death
Age = { 67, 83, 90, 73, 85 ,68, 78, 80, 53, 65 ,71 ,79 ,56 ,77 ,64 ,74 ,66, 49, 63 ,57, 70, 67, 58, 71, 60, 57, 67, 72, 60, 63, 46, 90, 78, 88, 64, 81, 93, 93 }
FillColumn[1,Age] (create from the spreadsheet view)
Note: change intervals to 10 years (40-49, 50-59, etc) so it is by decades :)
Видео Bar Graphs and Histograms using Geogebra канала Penelope Templeton
Показать
Комментарии отсутствуют
Информация о видео
Другие видео канала
 Histograms Using GeoGebra
 Investigation of graphs in Geogebra part 1
 Geogebra grouped frequency histogram
 How to Create a CUSTOM TOOL in GeoGebra
 Roller Coaster Project - Desmos
 Using Desmos for stats & graphs (quant data)
![Water filling concept of Cone and Cylinder using geogebra [Tutorial]](https://i.ytimg.com/vi/Ol2k-sjG5WU/default.jpg) Water filling concept of Cone and Cylinder using geogebra [Tutorial]
Water filling concept of Cone and Cylinder using geogebra [Tutorial] How to make a Histogram in Geogebra - Prob / Stat
 Statistiques avec GeoGebra : Série simple
 Dynamic WordArt in Excel with Bar in Bar Chart (Info-chart that shows % completion)
 Beschränktes Wachstum mit GeoGebra
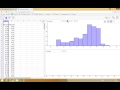 Statistics graphs on Geogebra
 Drawing the Mandlebrot Set with GeoGebra - part 1
 How to COPY & EDIT Existing GeoGebra Resources (from Others) to Create YOUR OWN Version(s)
 Making a histogram in Geogebra
![Online Maths Tutoring with Best Free Tool Geogebra [A Game Changer]](https://i.ytimg.com/vi/g2q3DiPKWqI/default.jpg) Online Maths Tutoring with Best Free Tool Geogebra [A Game Changer]
Online Maths Tutoring with Best Free Tool Geogebra [A Game Changer] Using Scratch to teach programming AND math standards
 PIE CHART || CONSTRUCTION OF PIE CHART BY GEOGEBRA || GeoGebra Applet || GeoGebra tutorial
 Column Chart That Displays Percentage Change in Excel - Part 1
 GeoGebra introduction: Constructing triangles