Statistics graphs on Geogebra
Update: This relates to what is now known as Geogebra classic (https://www.geogebra.org/classic) and is about using Geogebra to draw stats graphs, specifically:
Histograms, Bar Charts, Box plots, Stacked box plots, Cumulative frequency curves, Stem and Leaf diagrams, Bar charts. This goes through my experiences and recommendations for opening geogebra, getting data into geogebra and then a run through the graphs and the various options.
Note: On the scatter graphs, you can actually draw lines of best fit. See the 'Regression model' options underneath the chart.
Update: Starting Geogebra is a little different now. Look for the classic links or try entering /classic in the address bar.
Видео Statistics graphs on Geogebra канала Marcus Butler
Показать
Комментарии отсутствуют
Информация о видео
Другие видео канала
 Histograms Using GeoGebra
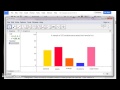 Bar Graphs and Histograms using Geogebra
 Geogebra grouped frequency histogram
 Using Histogram To Calculate Exposure
 A-level large data set box plot options
 how to use geogebra, part 1
 Excel Demo Log Log Plot
 inverses function graphs
 How to defend yourself against misleading statistics in the news | Sanne Blauw | TEDxMaastricht
 Creating Normal Curve (Bell Shape Curve) in Excel 2016 (Office 365) Not Shaded
 How to construct Area of Circle use GeoGebra by Ramesh Jaiswal
 Create a Frequency Polygon Chart
 How to Use Spreadsheet on Geogebra
 How statistics can be misleading - Mark Liddell
 Make a Cumulative Frequency Distribution and Ogive in Excel
 The graphical solution of a quadratic equation using GeoGebra
 Excel Filter Basics (for quick data analysis)
 Using Geogebra for Regression lines and r squared values
 Excel Print Options, Tips and Tricks Tutorial
 Introduction to GeoGebra