- Популярные видео
- Авто
- Видео-блоги
- ДТП, аварии
- Для маленьких
- Еда, напитки
- Животные
- Закон и право
- Знаменитости
- Игры
- Искусство
- Комедии
- Красота, мода
- Кулинария, рецепты
- Люди
- Мото
- Музыка
- Мультфильмы
- Наука, технологии
- Новости
- Образование
- Политика
- Праздники
- Приколы
- Природа
- Происшествия
- Путешествия
- Развлечения
- Ржач
- Семья
- Сериалы
- Спорт
- Стиль жизни
- ТВ передачи
- Танцы
- Технологии
- Товары
- Ужасы
- Фильмы
- Шоу-бизнес
- Юмор
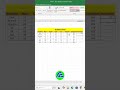
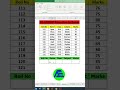
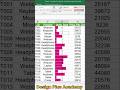
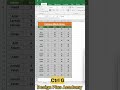
Pivot Table for Company list in Excel
"Pivot tables in Excel are powerful formula"
-free tools for summarizing, analyzing, and exploring large datasets with simple drag-and-drop actions. They allow users to instantly aggregate data by sum, count, or average, and reorganize rows and columns to change perspectives on data.
Key Steps to Create a Pivot Table:
Prepare Data: Ensure data is in a tabular format with unique headers for each column.
Insert Pivot Table: Click any cell in your data, navigate to the Insert tab, and select PivotTable.
Select Range: Confirm the data range and choose to place the report in a new or existing worksheet.
Populate Fields: Drag fields from the "PivotTable Fields" pane into the Rows, Columns, Values, or Filters areas.
Видео Pivot Table for Company list in Excel канала Design Plus Academy
Комментарии отсутствуют
Информация о видео
16 апреля 2026 г. 8:22:45
00:00:30
Другие видео канала