Scatter Diagrams Explained and Demonstrated with Excel
Excel Demonstration is at timecode 3:43.
The Scatter Diagram is explained and demonstrated using an example of students grades on an exam and the number of hours studied. The X and Y coordinates are plotted, and a positive relationship appears to exist. The terms Independent Variable and Dependent Variable are also explained, and we look at situations where there is a negative relationship between X and Y, and when there is no relationship. The Scatter diagram is demonstrated using the Chart Tool in Excel.
Видео Scatter Diagrams Explained and Demonstrated with Excel канала Learn Something
Показать
Комментарии отсутствуют
Информация о видео
Другие видео канала
 The Binomial Distribution
 Binomial Problem Solved Step By Step Using Both Excel's =BINOM.DIST Function and the Formula MyLab
 Sampling and Sampling Methods: Common Probability and Non-Probability Techniques
 Crosstabulations Explained and Demonstrated Using Excel
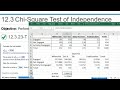 Chi Square Problems and Solutions with =CHISQ.TEST =CHISQ.INV.RT
 Five-Number Summary and Box Plot also Called Box and Wiskers Plot
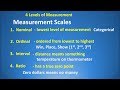 Defining | Classifying Variables and Measurement Scales
 Normal Distribution Problems and Solutions: Step by Step with =NORM.DIST =NORM.INV =NORM.S.DIST
 Probability Problems and Solutions | Step by Step
 SPSS Frequencies and Crosstabulations
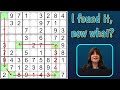 Remote Pairs Sudoku Chain Strategy
 Discover the SIMPLE Logic Behind the W-Wing
 The XYZ Wing, HOW to Find it, and WHY it works!
 The Sudoku BUG Problem and the BUG +1 Solution: A Subset to Uniqueness
 Sudoku 2-String Kite Explained with EXAMPLES
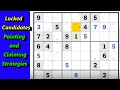 Locked Candidates as Elimination Techniques: Pointing and Claiming Sudoku Strategies
 Introduction to Hypothesis Testing Sigma Known Part 1
 Simple Linear Regression: Basic Concepts Continued Part II
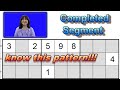 Pattern Recognition for Beginners: Completed Segments and Using Phantom or Ghost Numbers
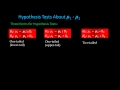 Inferences About Two Population Means, Sigma Known Part 1