TECH-018 - Compare Estimated Time vs Actual Time in a Time Line (Gantt Chart) in Excel
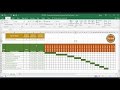
Learn how to compare Estimated Time vs Actual Time in a quick and simple Time Line (Gantt Chart) in Excel.
In a previous video I showed how to create a quick and simple Time Line (Gantt Chart) in Excel and here is the link to that video: https://www.youtube.com/watch?v=00s5efQWrgU
In this video I continued where I left off in the previous one, and I used the IF formula, the AND formula, as well as 'Greater Than' and 'Less Than' conditions to create the Actual Time Line (Gantt Chart) in your spreadsheet. I also used Conditional Formatting to enhance the looks of the Time Line.
I hope this concept is something you can use in your daily routine so you get more with less effort.
I hope this concept is something you can use in your daily routine so you get more with less effort.
If you have an Excel challenge that you need help with, whether it is at work, at home, or at school, please write it in the comments below. I try to resolve common Excel challenges from our viewers and subscribers.
Thank you for watching.
Check out some of our previous videos in the links below:
* TECH-017 - Create a presentation in Excel and navigate through it like a website
https://www.youtube.com/watch?v=3Wi_rnCrrJM
* TECH-016 - Create a countdown calendar and combine it with conditional formatting for each task
https://www.youtube.com/watch?v=KSHLjf9qo6M
* TECH-015 - Count total days by day of the week in a calendar in Excel
https://www.youtube.com/watch?v=1l1Bz7Nz9AE
* TECH-014 - Create a progress tracker with check box buttons in Excel
https://www.youtube.com/watch?v=gbDKwYPC4MI&t=12s
Видео TECH-018 - Compare Estimated Time vs Actual Time in a Time Line (Gantt Chart) in Excel канала The Excel Challenge
Показать
Комментарии отсутствуют
Информация о видео
Другие видео канала
 TECH-005 - Create a quick and simple Time Line (Gantt Chart) in Excel
 How to build Interactive Excel Dashboards
 Progress Bar in Excel Cells using Conditional Formatting
 Excel Dashboard - Plan vs Actual Variances - FREE Download
 Pivot Table with Progress Chart and Dashboard
 Excel Magic Trick 626: Time Gantt Chart -- Conditional Formatting & Data Validation Custom Formulas
 TECH-016 - Create a countdown calendar and combine it with conditional formatting for each task
 TECH-014 - Create a progress tracker with check boxes in Excel
 Interactive Excel Project Management Dashboard - FREE Download
 Infographics: Progress Circle Chart in Excel
 Simple Method to create Excel Gantt Chart with Dynamic Task Bar and Holidays Marker
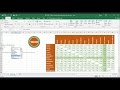 TECH-002 - Find a value in intersecting rows and columns in Excel
 How to Make a Gantt Chart in Excel
 How to make an attractive attendance tracker
 Project Plan(Gantt Chart) in excel
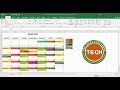 TECH-011 - Create a calendar in Excel that automatically updates colors by event category
 How to Create Gantt Chart in Excel with Pending, In Progress and Completed Status
 Introduction to Pivot Tables, Charts, and Dashboards in Excel (Part 1)
 Gantt Chart Excel Tutorial in Hindi || Make a gantt chart with automatic chart update with dates ||
 How to Create a Basic Excel Gantt Chart with Dynamic Task Bar