Variance, Standard Deviation, Coefficient of Variation
👉🏻 Download Our Free Data Science Career Guide: https://bit.ly/3iFyGUn
👉🏻 Sign up for Our Complete Data Science Training with 57% OFF: https://bit.ly/3ktDaPu
The coefficient of variation, variance, and standard deviation are the most widely used measures of variability. We'll discuss each of these in turn, finishing off with the coefficient of variation.
Download the working files used in the tutorial: https://www.dropbox.com/sh/0yvd6fgy4fbbvff/AABF-dgRWbRUXjWfGWrd7XQVa?dl=0
Variance measures the dispersion of a set of data points around their mean value. Population variance, denoted by sigma squared, is equal to the sum of squared differences between the observed values and the population mean, divided by the total number of observations.
Sample variance, on the other hand, is denoted by s squared and is equal to the sum of squared differences between observed sample values and the sample mean, divided by the number of sample observations minus 1.
While variance is a common measure of data dispersion, in most cases the figure you will obtain is pretty large and hard to compare as the unit of measurement is squared. The easy fix is to calculate its square root and obtain a statistic known as standard deviation. In most analyses you perform, standard deviation will be much more meaningful than variance.
Alright. The other measure we still have to introduce is the coefficient of variation. It is equal to the standard deviation, divided by the mean. Another name for the term is relative standard deviation. This is an easy way to remember its formula – it is simply the standard deviation relative to the mean. As you probably guessed, there is a population and sample formula once again.
► Consider hitting the SUBSCRIBE button if you LIKE the content: https://www.youtube.com/c/365DataScience?sub_confirmation=1
► VISIT our website: https://bit.ly/365ds
🤝 Connect with us LinkedIn: https://www.linkedin.com/company/365datascience/
365 Data Science is an online educational career website that offers the incredible opportunity to find your way into the data science world no matter your previous knowledge and experience. We have prepared numerous courses that suit the needs of aspiring BI analysts, Data analysts and Data scientists.
We at 365 Data Science are committed educators who believe that curiosity should not be hindered by inability to access good learning resources. This is why we focus all our efforts on creating high-quality educational content which anyone can access online.
Check out our Data Science Career guides: https://www.youtube.com/playlist?list=PLaFfQroTgZnyQFq4nUfb-w2vEopN3ULMb
#Coefficient #Variation #Statistics
Видео Variance, Standard Deviation, Coefficient of Variation канала 365 Data Science
Показать
Комментарии отсутствуют
Информация о видео
Другие видео канала
 The Normal Distribution and the 68-95-99.7 Rule (5.2)
 Covariance, Clearly Explained!!!
 Real-world application of the Central Limit Theorem (CLT)
 Find the Mean, Variance, & Standard Deviation of Frequency Grouped Data Table| Step-by-Step Tutorial
 Teach me STATISTICS in half an hour!
 Measures of Variability (Range, Standard Deviation, Variance)
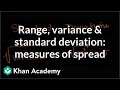 Range, variance and standard deviation as measures of dispersion | Khan Academy
 Skills Needed to Become a Data Scientist
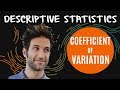 What is the Coefficient Of Variation?? (+ examples!)
 What is COVARIANCE? What is CORRELATION? Detailed video!
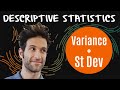 Variance and Standard Deviation: Why divide by n-1?
 Correlation and Regression: Concepts with Illustrative examples
 How to Become a Business Analyst
 Probability: Types of Distributions
 p-values: What they are and how to interpret them
 Mode, Median, Mean, Range, and Standard Deviation (1.3)
 Python Jobs to Pursue in 2021
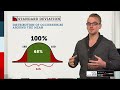 Standard Deviation Explained | Options Trading Concepts
 What is Variance in Statistics? Learn the Variance Formula and Calculating Statistical Variance!